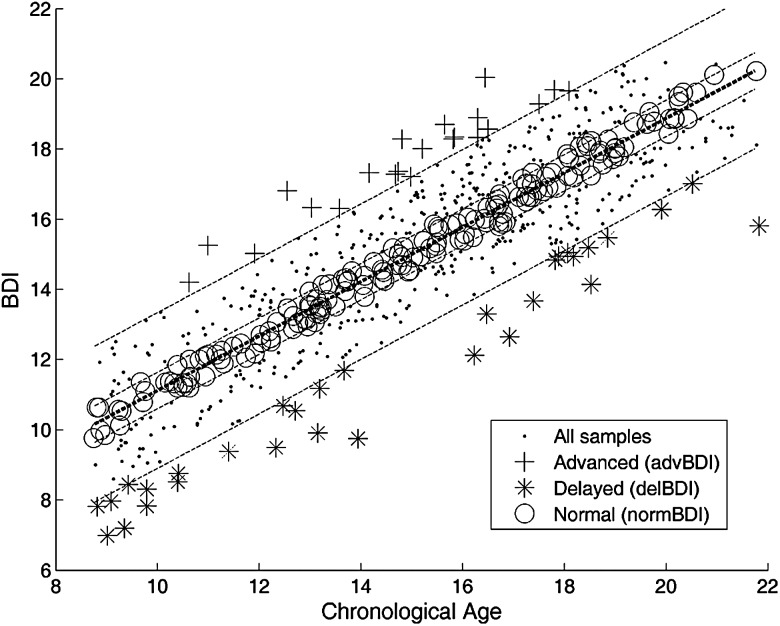
Figure 2.
Scatter plot of BDIs versus chronological ages of 621 subjects. The BDIs were calculated through 10-fold cross-validation, using the model trained on the combination of all image maps. The correlation between the chronological age and the BDI is r = 0.89. The bold dotted line shows the linear regression line. 90% and 30% prediction intervals are shown with dotted lines. The subjects outside the 90% prediction interval have been labeled as outliers (advanced or delayed brain development). The subjects within the 30% prediction interval have been labeled as normally developed.

