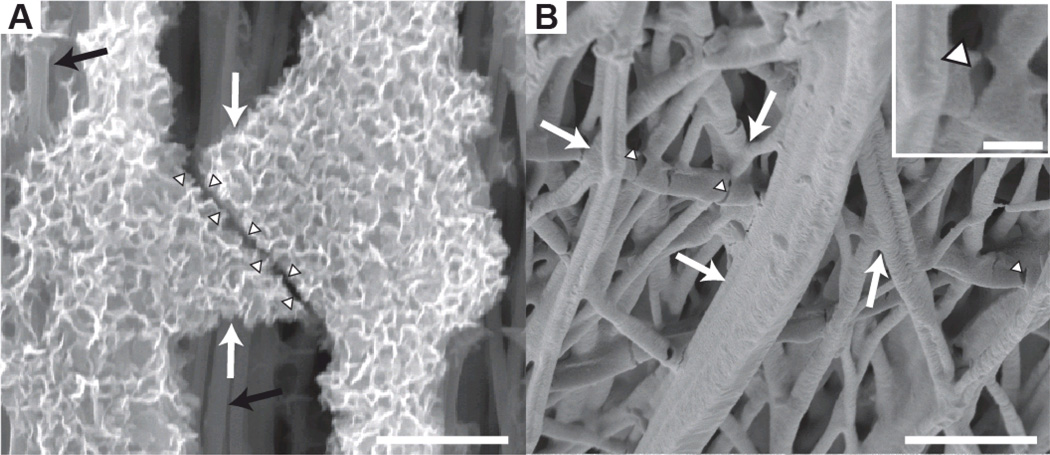
Figure 6.
SEM analysis demonstrated mineral bonding between fibers. (white arrows: mineral bridges; arrowheads: mineral bridge fractures, black arrows: polymer fibers with little to no mineral. Scale bars = 5 µm, inset scale bar = 1 µm) (A) An image from a 10SBF scaffold shows a fractured mineral bridge with crystalline morphology. (B) An image from the m10SBF group shows a more conformal layer of mineral that bonds adjacent fibers. Inset is magnified image of a mineral bridge fracture.

