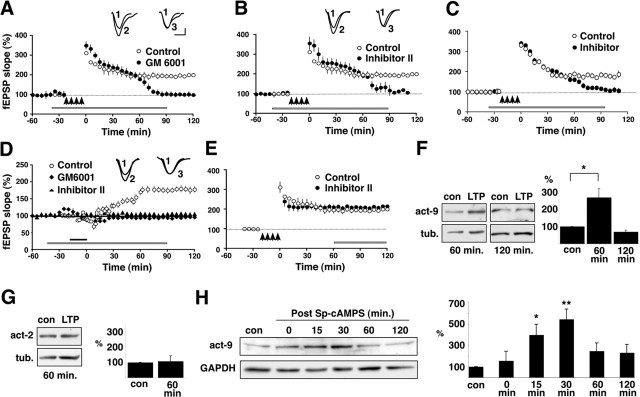
MMP-9 is required for, and upregulated during, L-LTP in area CA1. A, Young rat hippocampal slices were subjected to an L-LTP-inducing tetanic stimulation protocol (arrows; four trains of 100 Hz, 1 s stimulation separated by 5 min), which produces both an E-LTP and a long-lasting L-LTP (open circles). In contrast, in the presence of GM6001 (25 μm), a broad-spectrum MMP inhibitor (bar), normal E-LTP is elicited but L-LTP is abolished, as shown by the return of the trace to baseline levels between 60 and 90 min (filled circles; n = 6 rats). Inset, Representative EPSP traces were recorded before tetanus (1), 90 min after tetanus (2), and 90 min after tetanus in the presence of GM6001 (3). B, Young rat hippocampal slices exposed to an MMP-2/9 inhibitor (Inhibitor II; 50 μm) and subjected to L-LTP-inducing tetanic stimulation also show normal E-LTP but abolishment of L-LTP (filled circles). Other conventions are as in A. Inset, Representative EPSP traces were recorded before tetanus (1), 90 min after tetanus (2), and 90 min after tetanus in the presence of Inhibitor II (3). C, Hippocampal slices from adult rats exposed to Inhibitor II (bar) and subjected to L-LTP-inducing tetanic stimulation (arrows) also show a normal E-LTP (filled circles) compared with control slices (open circles), but L-LTP is abolished. This pattern is identical to that observed in young rat slices (compare with Fig. 1A,B). D, Rat hippocampal slices bath exposed to Sp-cAMPS (20 min; solid bar) show a robust, slowly developing cLTP (open circles). In contrast, cLTP is abolished in slices coincubated in Sp-cAMPS and either GM6001 (25 μm; filled diamonds) or Inhibitor II (50 μm; filled triangles; duration of inhibitor shown by gray bar). Inset, Representative EPSP traces were recorded before Sp-cAMPS application (1), 90 min after Sp-cAMPS application (2), and 90 min after Sp-cAMPS in the presence of Inhibitor II (3). E, Exposing rat hippocampal slices to the MMP-2/9 inhibitor (bar) after tetanically induced L-LTP is established has no effect on maintenance of L-LTP (filled circles); the potentiation in treated slices is indistinguishable from that in untreated control slices (open circles). F, Pairs of representative immunoblots of homogenates from area CA1 frozen 60 min (left pair) or 120 min (right pair) after control or L-LTP-inducing tetanic stimulation. Membranes were probed with antibodies that recognize the active form of MMP-9 (act-9) or tubulin. The summary graph (right) shows the mean band intensity normalized to corresponding time-matched controls. There is a significant elevation in the levels of the active form of MMP-9 at 60 min after LTP stimulation (*p < 0.03; n = 3), but levels return to control values by 120 min. G, Representative immunoblot of homogenates from area CA1 frozen 60 min after control or L-LTP-inducing tetanic stimulation. Membranes were probed with antibodies that recognize the active form of MMP-2 (act-2) or tubulin. The summary graph shows that there are no changes in the levels of active MMP-2 at this time point after LTP stimulation (n = 3), nor are there any changes in the levels of MMP-2 at other times up to 120 min after stimulation (other time points not shown). H, Representative immunoblot of homogenates from area CA1 subjected to cLTP by brief bath exposure to Sp-cAMPS and frozen at the times indicated after washout of Sp-cAMPS. Membranes were probed with antibodies recognizing the active form of MMP-9 or GAPDH. The summary graph (n = 3 per time point) shows that levels of the active form of MMP-9 increase by 15 min after washout of Sp-cAMPS, peak by 30 min, and decline toward baseline thereafter through 120 min. *p < 0.05; **p < 0.005. Error bars indicate SEM. Calibration: 10 ms, 0.2 mV. con, Control; tub., tubulin.

An official website of the United States government
Here's how you know
Official websites use .gov
A
.gov website belongs to an official
government organization in the United States.
Secure .gov websites use HTTPS
A lock (
) or https:// means you've safely
connected to the .gov website. Share sensitive
information only on official, secure websites.
