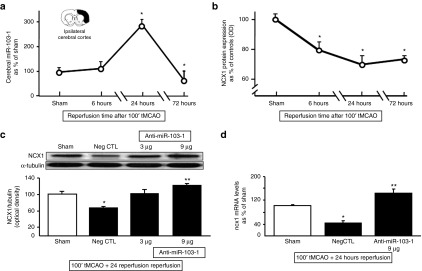
Figure 4.

Time-course of miR-103-1, NCX1 protein, and NCX1 mRNA in rat ischemic brain cortex; identification of effective anti-miR-103-1 dose. (a) Time-course of miR-103-1 expression levels in cerebral cortex samples harvested from rats subjected to 100' tMCAO and sacrificed at 6, 24, and 72 hours. Results are expressed as fold changes of expression of miR-103-1 compared to sham. (b) Time-course NCX1 expression levels in cerebral cortex samples harvested from rats subjected to 100' tMCAO and sacrificed at 6, 24, and 72 hours. Results are expressed as fold changes of expression of NCX1 compared to sham and normalized for α-tubulin. n = 3–4 animals per group. *P < 0.05 versus sham-operated group in both expression profiles. Each point of the graphic line represents the mean ± SEM. (c) A quantitative analysis of NCX1 protein expression levels in ipsilateral damaged brain area of rats subjected to tMCAO and treated with negative control (Neg CTL), anti-miR-103-1 2 µg/kg, and anti-miR-103-1 9 µg/kg. A representative western blotting is included on the top of panel (c). (d) Changes in expression levels of ncx1 mRNA from ischemic brain cortex samples of rats subjected to tMCAO and treated with negative control (NegCTL), and anti-miR-103-1 9 µg/kg (anti-miR-103-1 9) compared to ncx1 mRNA expression in sham-operated animals. n = 5 per group. Data were normalized on the basis of α-tubulin levels and expressed as percentage of sham-operated controls (Sham). *P < 0.05 versus sham-operated group; **P < 0.05 versus negative control group and versus sham-operated group. mRNA levels are expressed as percentage of sham-operated controls (Sham). Each column represents the mean ± SEM.
