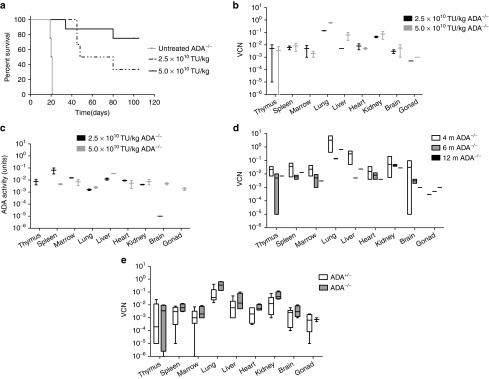
Figure 2.

Systemic administration of the lentiviral vector in ADA−/− and ADA+/− mice. (a) Kaplan–Meier survival curves of ADA−/− mice when treated with 5.0 × 10¹⁰ TU/kg (N = 8), 2.5 × 10¹⁰ TU/kg (N = 6), or untreated (N = 4). (b) Box and whisker (10–90th percentile) plots of tissue vector copy number from ADA−/− mice at 6 months (N = 2 for each dose). (c) Box and whisker (10–90th percentile) plots of ADA enzyme activity at 6 months (N = 2 for each dose). (d). Floating bar (min–max) plots of tissue vector copy number over time (4 months, N = 5; 6 months, N = 2; 12 months, N = 1) in ADA−/− mice treated with 5.0 × 10¹⁰ TU/kg. (e) Box and whisker (10–90th percentile) plots of tissue vector copy number from ADA−/− mice (N = 4) and ADA+/− littermates (N = 6) at 6 months (combined data for 2.5 and 5.0 × 10¹⁰ TU/kg dose).
