Figure 1.
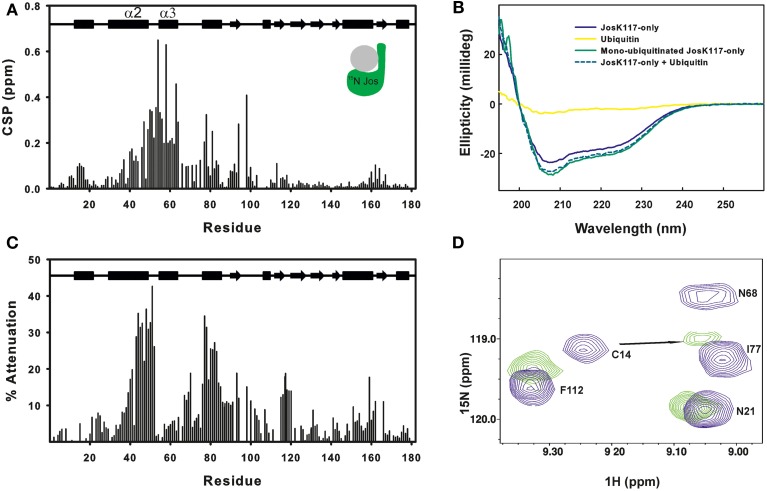
Mapping ubiquitination on the Josephin surface. (A) Chemical shift perturbation of the changes occurring on 15N labeled Josephin domain after ubiquitination of JosK117-only. (B) Far-UV CD spectra of JosK117-only (blue), mono-ubiquitinated JosK117-only (green), ubiquitin (yellow). The arithmetical sum of the spectra of JosK117-only and of free ubiquitin is reported in dashed cyan. (C) Cross-saturation experiment on perdeuterated 15N JosK117-only covalently attached to unlabeled ubiquitin on K117. (D) 15N HSQC spectra for the C14 peak before (blue) and after (green) ubiquitination.

