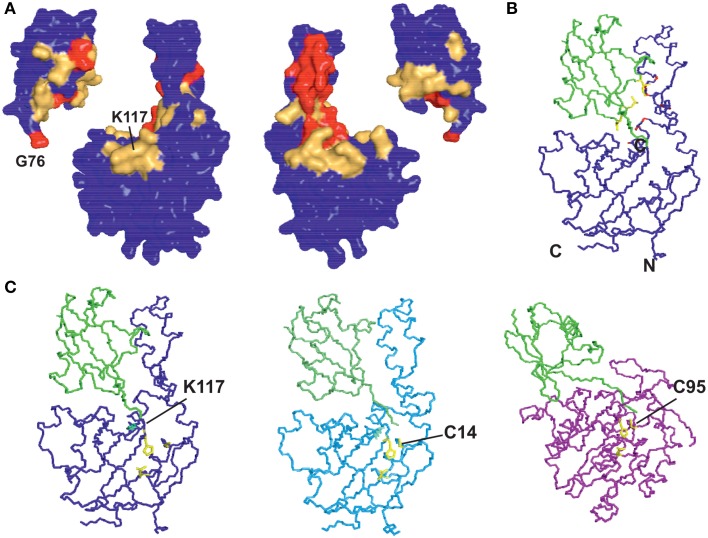
Figure 5.
Restraints used in the calculation and resulting structure. (A) Mapping the cross saturation effects and CSP on the structures of Josephin and ubiquitin, respectively. The color coding used is the following: cross saturation on Josephin is indicated in red and orange for values of attenuation >30% and 10–30%, respectively. Values of CSP >0.3 ppm and 0.1–0.3 ppm are marked in red and orange on the surface of ubiquitin. (B) Mapping intermolecular NOE effects between JosK117-only and ubiquitin on the best HADDOCK model in terms of energy and restraint violations. In yellow are shown the side chains of the ubiquitin residues selected in the calculation (L8, T9, I44). In red are marked the involved (unambiguous) JosK117-only residues. (C) Comparison of the model of mono-ubiquitinated JosK117-only obtained using the software HADDOCK (left) with the crystal structures of the Josephin-like domain from ATXN3L (center, 3O65) and of the DUB UCH-L3 (right, 1XD3), both linked to ubiquitin by the catalytic cysteine (explicitly indicated). The structure of the UCH-L3/ubiquitin assembly is thought to mimic that of the reaction intermediate and suggests that, despite specific differences, ubiquitin binds DUB enzymes adopting approximately equivalent orientations as respect to the catalytic triads.

