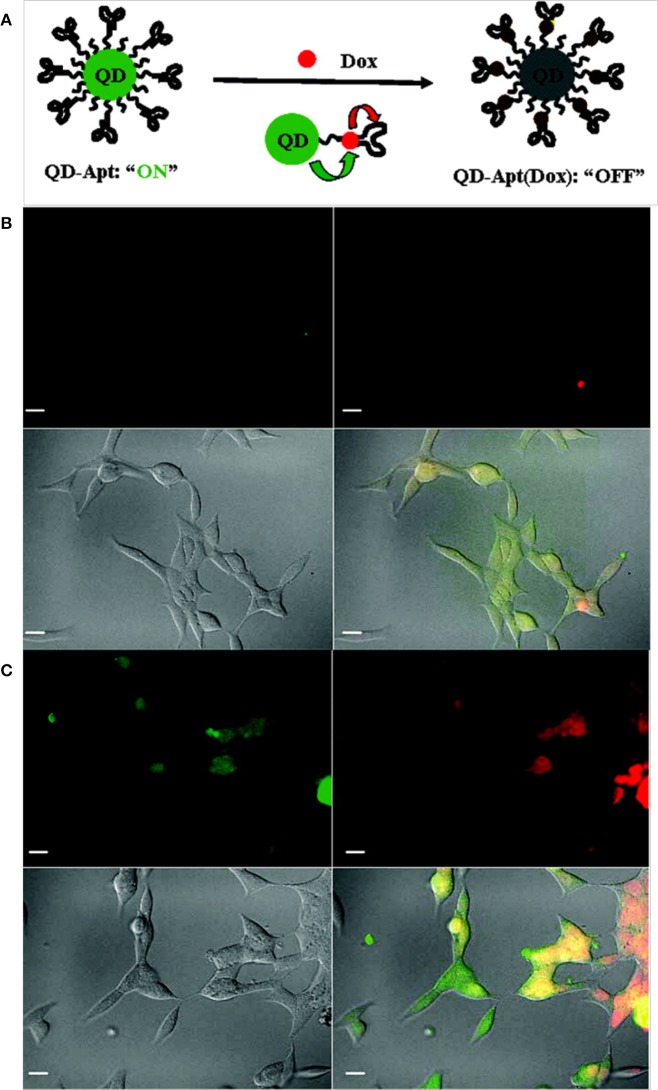
Figure 4.
(A) A schematic illustration of QD-Apt(Dox) Bi-FRET. Confocal laser scanning microscopy images of QD-Apt DOX conjugates incubated in PSMA-expressing LNCaP cells at (B) 0 h and (C) 1.5 h. DOX and QDs are shown in red and green, respectively, and the lower right images in each panel represent an overlay of DOX and QD fluorescence (Bagalkot et al., 2007), © 2007, American Chemical Society.

