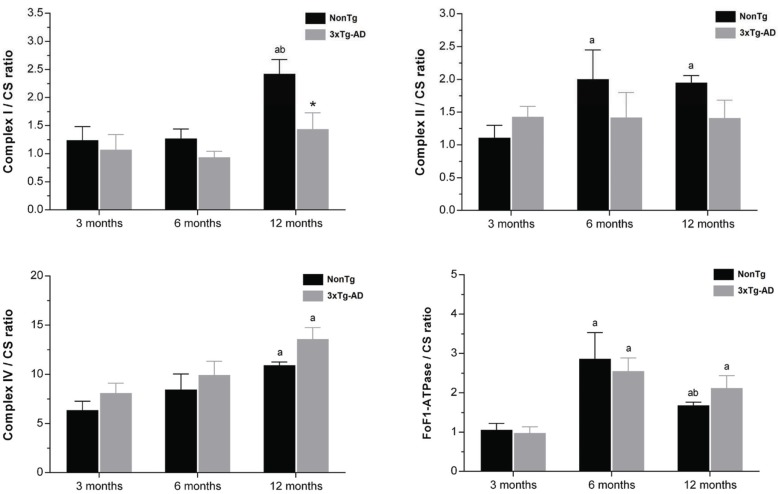
Fig. (3).
Mitochondrial complexes I, II and IV and FoF1 ATPase activities normalized by citrate synthase activity (CS). Black and gray bars represent skeletal muscle mitochondria isolated from nonTg and 3xTg-AD mice, respectively, with 3, 6 and 12 months of age. Error bars represent standard deviation for n≥3 independent experiments using 3 animals in each one. *Significantly different from nonTg group, with p≤0.05.a,b Significantly different from 3 and 6 months of age, respectively, with p≤0.05.

