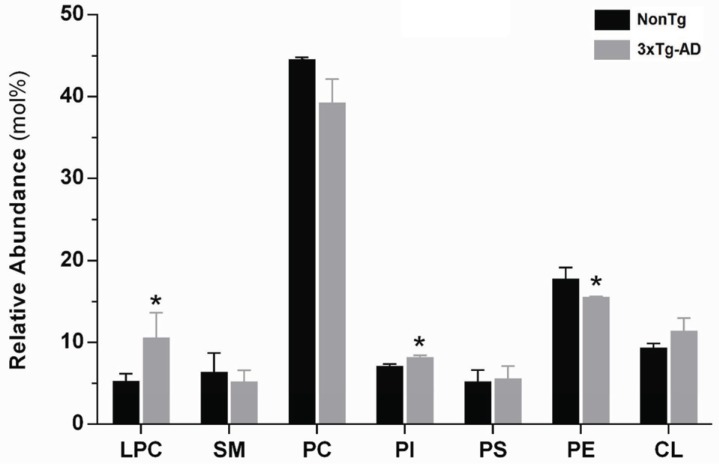
Fig. (5).
Relative abundance (mol%) of each phospholipid classes in total lipid extract of skeletal muscle tissue from nonTg (black bars) and 3xTg-AD (gray bars) mice with 12 months of age. LPC, lyso-phosphatidylcholine, SM, sphingomyelin, PC, phosphatidylcholine, PI, phosphatidylinositol, PS, phosphatidylserine, PE, phosphatidyl-ethanolamine, CL, cardiolipin. Error bars represent standard deviation for n=3 independent experiments using 3 animals each in each one. The amount of each phospholipid class was calculated by the sum of its individual species identified and quantified by HPLC-MS/MS, as described in methods section. Considering the results as total nmoles of phospholipids per mg of protein in skeletal muscle homogenates: nonTg 107.66±18.30 and 3xTg-AD 90.32±10.20. *Significantly different from nonTg group, with p≤0.05.

