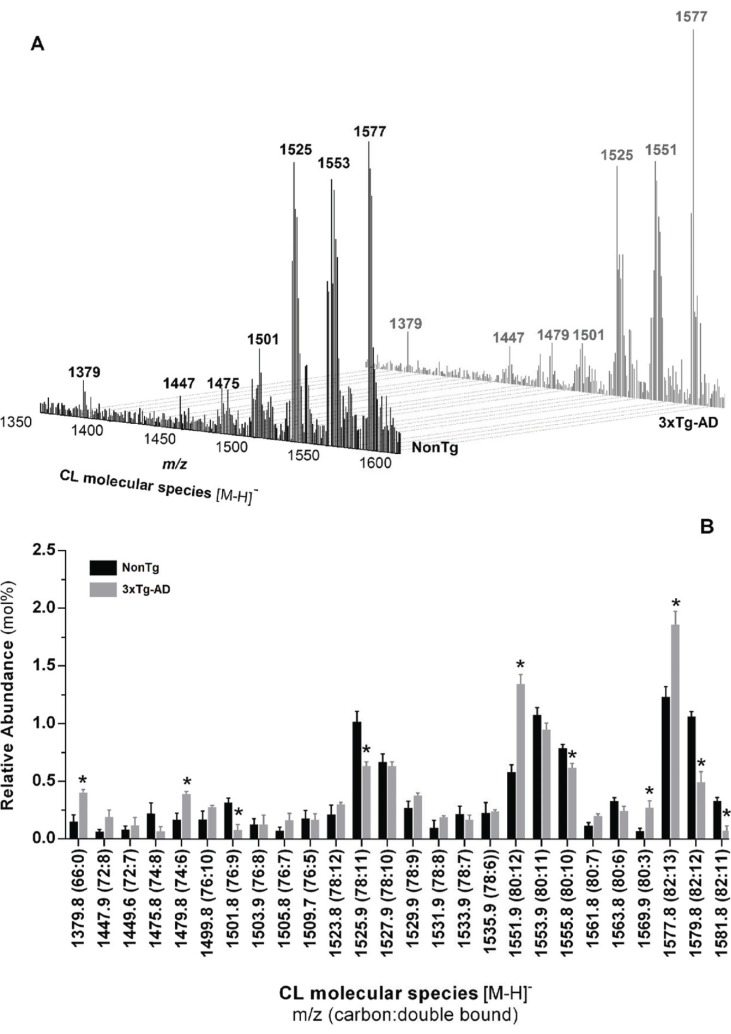
Fig. (8).
Molecular profile of CL extracted from skeletal muscle homogenates of nonTg (black bars) and 3xTg-AD (gray bars) mice with 12 months of age. Typical ESI-MS of CL obtained in negative ion mode (A) and the respective distribution molecular species (B). Error bars represent stand-ard deviation for n=3 independent experiments using 3 animals in each one. *Significantly different from non Tg group, with p≤0.05.

