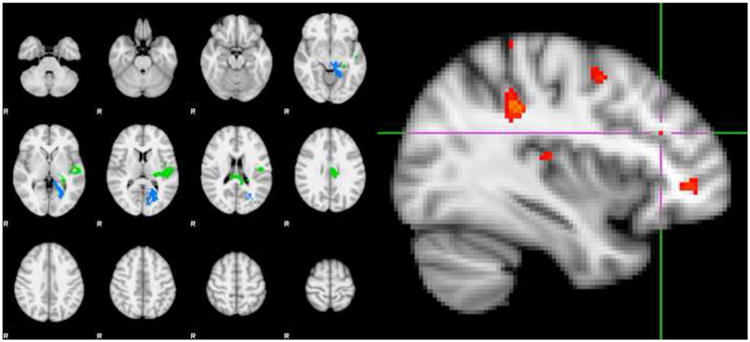
Figure 3.

Exploratory Whole Brain Analysis.
|
| |||||
| Cluster Index | Z | x | y | z | FSL Harvard-Oxford Cortical Atlas Label |
|
| |||||
| Blue | 3.8 | -22 | -68 | 8 | Left Intracalcarine Cortex |
| Blue | 3.84 | -18 | -48 | -2 | Left Lingual Gyrus |
| Blue | 3.98 | 20 | 72 | 10 | Left Intracalcarine Cortex |
| Blue | 4.25 | -12 | -40 | -4 | Left Parahippocampal Gyrus, posterior division; extending into the Left Lingual Gyrus |
| Green | 3.45 | -46 | -14 | 18 | Left Central Opercular Cortex |
| Green | 3.46 | -50 | -24 | 2 | Left Planum Temporale |
| Green | 3.72 | -48 | -22 | 6 | Left Heschl's Gyrus |
| Green | 4.11 | -6 | -22 | 28 | Left Cingulate Gyrus, posterior division |
|
| |||||
| Peak DLPFC Voxel | 2.67 | -36 | 30 | 24 | Left Middle Frontal Gyrus (p<0.004, uncorrected) |
|
| |||||
Exploratory whole brain comparison of rs1625579 TT versus GG/TG genotypes showed two significant clusters (z=2.3, p<0.05), which included peak activations in the Left Cingulate Gyrus - posterior division, Left Heschl's Gyrus extending into the Left Planum Temporale, the left Central Opercular Cortex, the Left Parahippocampal Gyrus – posterior division, extending in the Left Lingual Gyrus and Left Intracalcarine Cortex; Left Figure). Exploratory examination beyond the significant clusters, for the rs1625579 TT > rs1625579 GG/TG genotype contrast at z=2.67, p<0.004 (uncorrected) showed significant voxels in the Left Middle Frontal Gyrus activation (Right Figure).
