
Fig. 3.
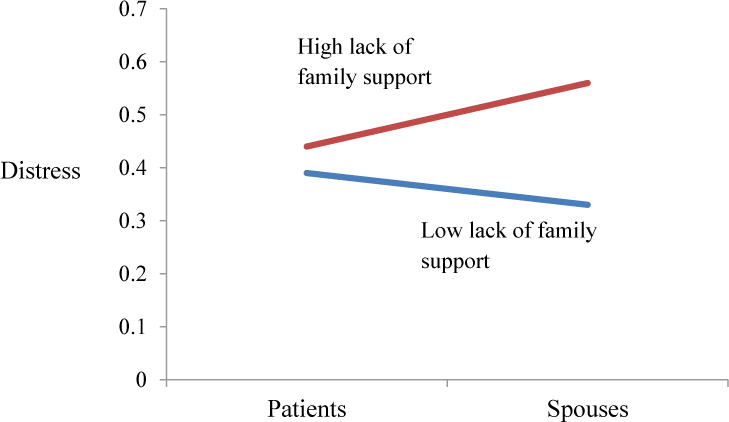
A multilevel model analysis reveals an interaction (p=0.10) depicting 6-month follow-up distress as a function of baseline lack of family support and social role. Scores are plotted at the mean ±1 standard deviation. Higher scores indicate greater distress.