Figure 2.
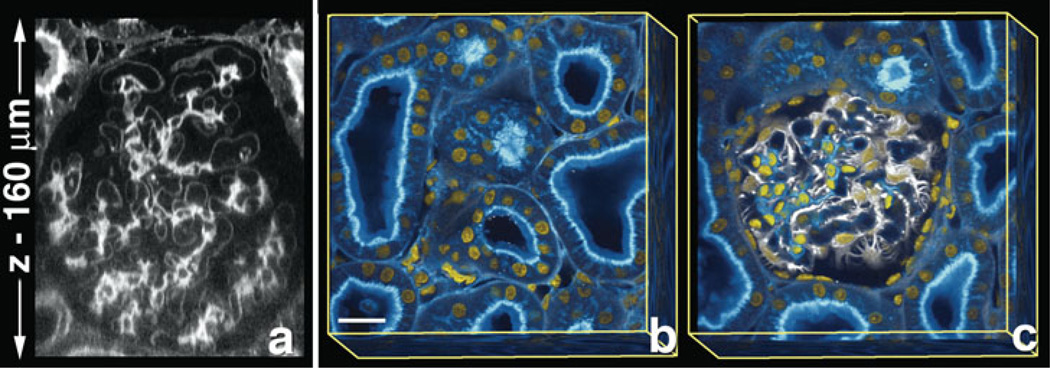
Clearing allows visualization of intact 3D organization within tissues. Fixed adult rat kidney tissue was imaged using clearing plus increase of laser intensity with depth. (a) Single xz-section of rat kidney stained with FITC-conjugated-lens culinaris agglutinin. Rendered volume, 160 µm total depth (b, c), of rat kidney stained with FITC-conjugated-lens culinaris aggutinin (blue), vimentin labeled podocytes (white), and Hoechst labeled nuclei (yellow). (b) The surface of whole volume shows a network of kidney tubules. Superficial planes removed from panel b show the glomerulus within the network of tubules (c). (b, c) Bar = 20 µm.

