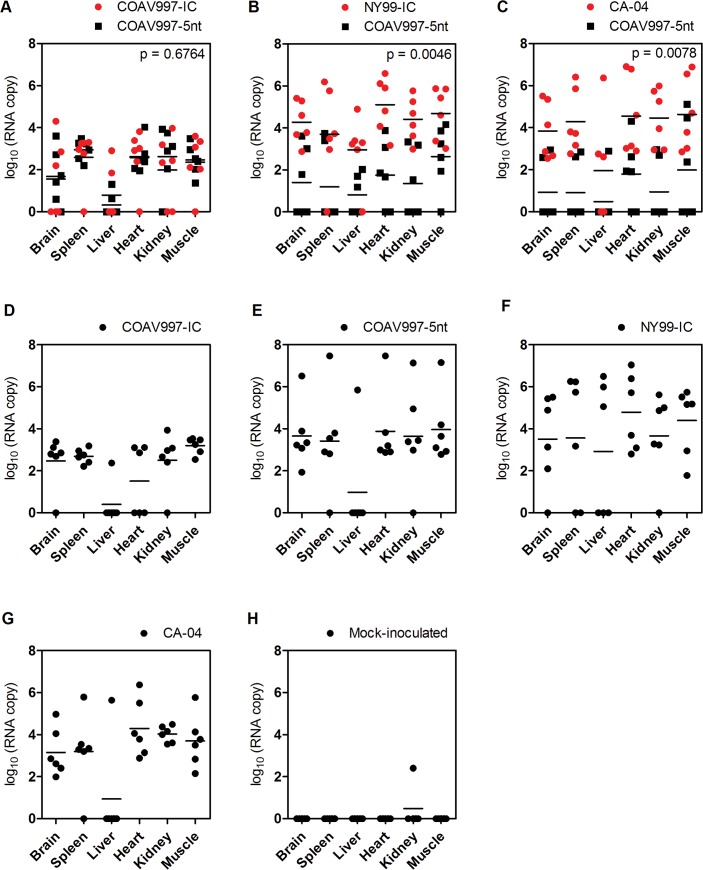
Fig 4. RNA copy numbers in tissues of HOFIs.
Homogenates of brain, spleen, liver, heart, kidney and muscle were analyzed by qRT-PCR. RNA copies (as log10 on y-axis) for each bird and tissue (x-axis) are shown as dots in red and black color for wildtype and COAV997-5nt RNA, respectively, with horizontal lines indicating mean values. P values < 0.05 indicate statistically significant differences between wildtype and COAV997-5nt RNA copy numbers.

