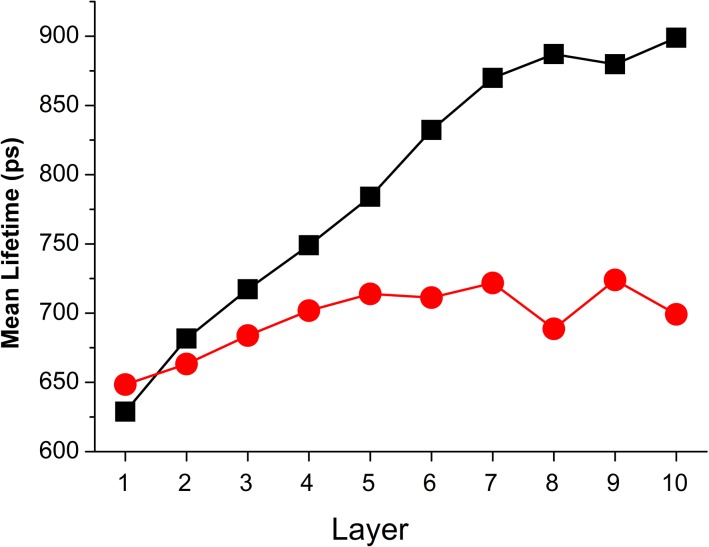
Fig 4. Distribution of mean τ2 in all divided 10 layers for normal (black square) and precancerous (red circle) samples.
Here, the mean τ2 for each pathological state was calculated from the sample pool which includes 10 normal, 8 CIN1, 6 CIN2 and 8 CIN3 cervical tissue sections and the averaged relative standard deviation (RSD) was calculated to be 18% for all categories. More details regarding error bars are clarified in S5 Fig.

