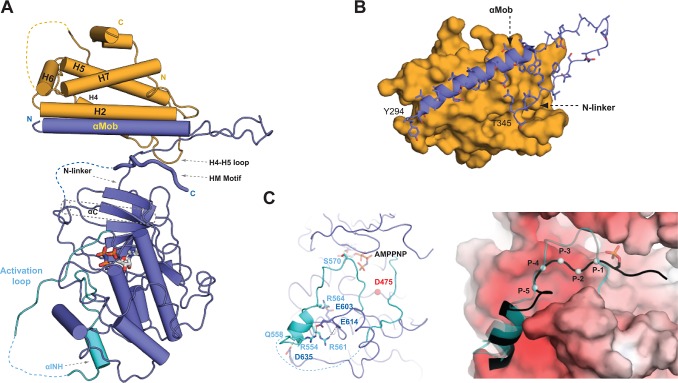
Fig 2. Structure of the Cbk1–Mob2 complex.
(A) An overview of the Cbk1–Mob2 complex. Mob2 (orange) binds to the N-terminal region of Cbk1 (blue) through a large surface formed by the H2 and H7 helix and the H4–H5 loop. “N” and “C” denote the N- and C-terminal ends of the protein constructs. Flexible regions that could not be located in the electron density maps are shown with dashed lines. HM is the AGC kinase HM, and “αINH” denotes the inhibitory alpha helix that is part of the activation loop (shown in cyan). (B) The N-terminal region of the Cbk1 forms a bipartite Mob2-binding surface comprised of a long αMob helix and a highly conserved arginine rich N-linker region. (C) An activation loop segment (cyan) of Cbk1 containing the major autoregulatory site (S570) blocks access to the active site (D475) (left panel). An inhibitory helix (αINH in [A]) is anchored in the substrate-binding groove by several salt bridges (shown with black dotted lines). The substrate binds in the negatively charged “open” binding pocket that replaces αINH (shown in cyan), as seen in the state with the bound αINH (right panel). The model for the Cbk1–substrate complex was generated by superimposing the crystallographic model of the “open” state of Cbk1 with PKA binding to a phosphorylated substrate (Protein Data Bank [PDB] ID: 1JLU). The black cartoon with gray spheres (from P-1 to P-5 Cα positions) shows the PKA substrate superimposed in the Cbk1 substrate-binding pocket, while the activation loop of Cbk1, which displays the characteristics of a pseudo-substrate region, is shown with the semitransparent cartoon representation in cyan. The surface of Cbk1 is colored according to its electrostatic potential, where red indicates negatively charged surface. The nucleotide cofactor (AMPPNP) is shown in stick representation.

