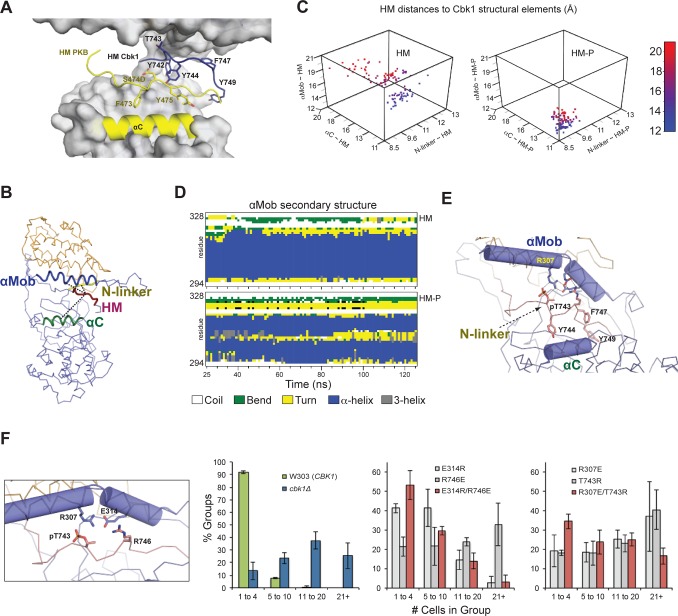
Fig 3. Molecular dynamics simulation indicates phosphorylation-induced rearrangement of the NDR/LATS kinase HM-binding slot to favor enzyme activation.
(A) Comparison of the Cbk1 HM with the HM of PKB. The panel shows the Cbk1–Mob2 complex superimposed with PKB, where the αC helix and the HM of the superimposed PKB are shown in yellow (PDB ID: 1O6K). Side chains of important HM residues are shown with sticks. Superimposition of PKB and Cbk1–Mob2 reveals that the main chains of the HM motifs are >7 Å apart. The Cbk1 HM motif is shifted upwards to bind to the upper part of the HM-binding slot, while the PKB HM binds close to the N-terminal PKB kinase lobe. (B) Cbk1–Mob2 complexes in which T743 in the C-terminal HM is either dephosphorylated (HM-T) or phosphorylated (HM-P) were subjected to 125-ns MD simulations. Here we represent indicated regions of Cbk1 as centers of mass of the following: HM, amino acids 742–749; N-linker, amino acids 341–346; αC, amino acids 393–406; αMob, amino acids 297–317. We started distances of both HM forms to the N-linker region, αC, and αMob at [8.7 Å; 18.0 Å; 14.9 Å], corresponding to the conformational state captured in the Cbk1–Mob2 complex crystal structure, and recalculated the distances between HM forms, N-linker, αC, and αMob after each simulation step. (C) Three-dimensional scatter plots show 100 ns of the simulations, with each dot indicating N-linker–HM, αC–HM, and αMob–HM distances (x-, y-, and z-axes) for each nanosecond. For clarity, dots are colored from blue to red according to their αMob–HM distances (z-axis). The complex with HM-P exhibits shorter distances and smaller changes in position, indicating that T743 phosphorylation compresses the HM-binding slot and constrains the HM region association. This occurs only in Cbk1 bound to Mob coactivator (see S5 Fig). (D) HM phosphorylation promotes αMob bending and compresses the HM binding slot. Secondary structure analysis of αMob illustrates that this region remains helical (blue) when HM-T is bound, but acquires a short turn (yellow) when HM-P is bound. (E) An enlarged view of the final MD-simulated Cbk1(HM-P)–Mob2 complex indicates the HM-P’s interactions that bend αMob, as well as van der Waals contacts with αC. (F) Ionic interactions suggested by the MD model (E314/R746 and R307/pT743) (left) were tested by charge swapping and analysis of cell separation. Single mutants (grey) displayed larger group sizes, indicating defective RAM network function, but were partially recovered when both charged sites were swapped (red). Data for (C) and (F) can be found in S1 Data.

