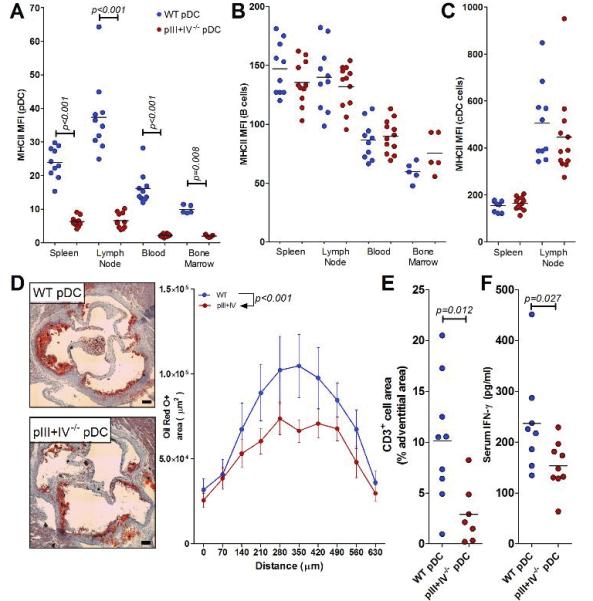
Figure 5.
Conditional MHCII deficiency in pDCs decreases atherosclerosis in B cell- sufficient mice. A-C. Mean fluorescence intensity (MFI) of MHCII staining on pDCs (A), B cells (B) or cDCs (C). D. Representative images of plaque area. Bar represents 100 μm. Quantification of total plaque area at the aortic root in 10 serial sections beginning at the start of the aortic valves (0 μm). Data represents mean ± S.E at each position (n=10 WT pDC group, 12 pIII+IV−/− pDC group). E. Quantification of CD3+ cells in the vascular lesions. F. Serum IFN-γ quantified by luminex assay (see methods). For each figure, significant differences between groups are indicated by p values.

