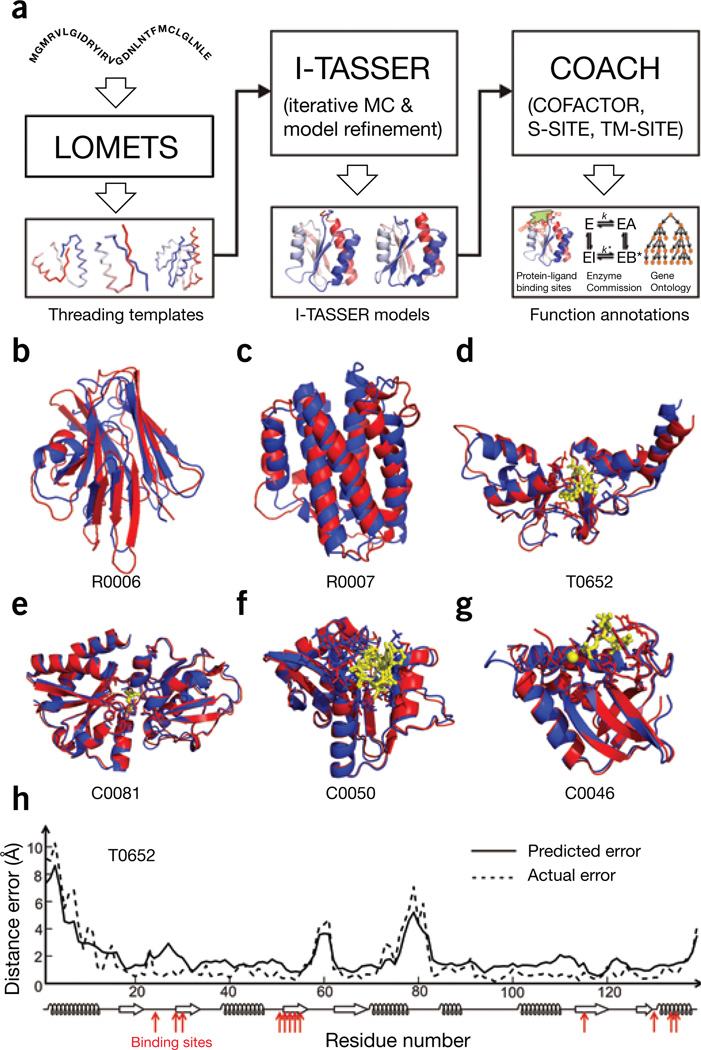
Figure 1.
Flow chart and illustrative examples of I-TASSER Suite for protein structure and function modeling. (a) Flowchart of the I-TASSER Suite pipelines that consist of LOMETS-based template identification, I-TASSER–based Monte Carlo (MC) structure assembly simulation and COACH-based function annotation. (b–g) Examples of protein structure and function prediction, where protein structures by I-TASSER and X-ray diffraction experiments are presented as blue and red cartoons, respectively, with ligand-binding residues highlighted by sticks over the cartoons. The ligand structures by COACH and experiments are shown as yellow stick-and-ball forms and sticks, respectively. Modeling parameters for all the targets are listed in Supplementary Table 3. Shown are a hypothetical protein BT_4147 from Bacteroides thetaiotaomicron (CASP ID: R0006; PDB ID: 4e0eA) (b), interleukin-34 protein from Homo sapiens (CASP: R0007; PDB: 4dkcA) (c), magnesium and cobalt efflux protein CorC from Escherichia coli bound to adenosine monophosphate (CASP: T0652; PDB: 4hg0A) (d), nutrient binding protein from Burkholderia cenocepacia bound to methionine (CAMEO: C0081; PDB: 4qhqA) (e), N-acyltransferase from Escherichia coli bound to acetyl–coenzyme A (CAMEO: C0050; PDB: 4qvtA) (f) and thermonuclease from Staphylococcus aureus bound to calcium ion and thymidine-3′,5′-diphosphate (CAMEO: C0046; PDB: 4qf4A) (g). (h) Illustrative example of the residue-level distance error estimations for T0652, where solid lines are predicted errors and dashed lines are actual errors of the I-TASSER model relative to the experimental structure. Bottom, secondary structure prediction; red arrows indicate the ligand-binding sites.

