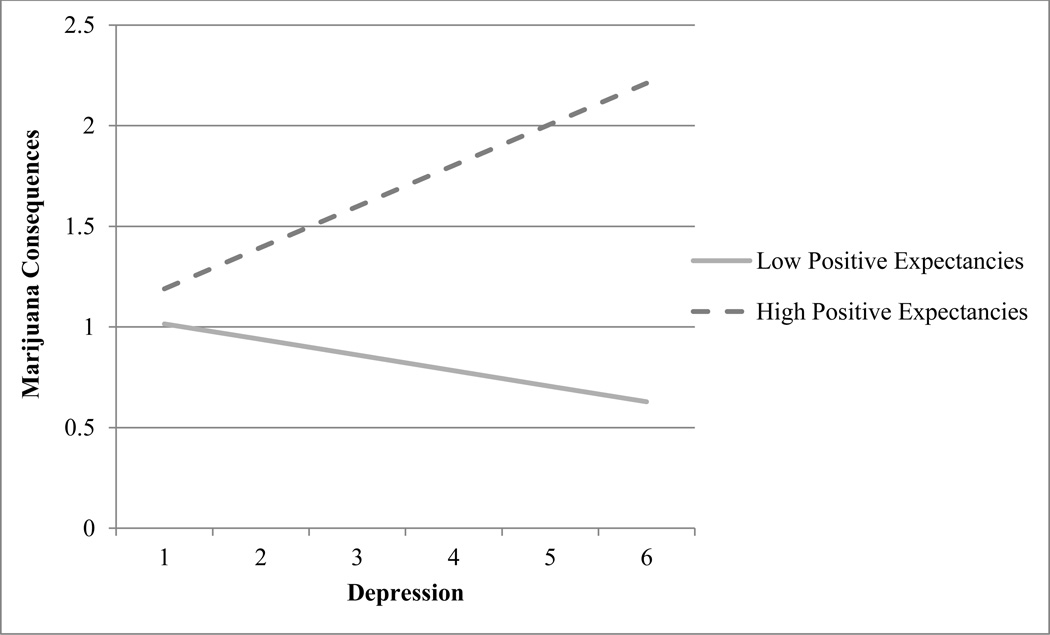
FIGURE 2.
Positive expectancies moderate the relationship between depressive symptoms and marijuana consequences.
Note: higher values on the X-axis indicate greater frequency of depressive symptoms. Solid and dotted lines within the axes represent the line of best fit for an individual with low (score = 1) and high (score = 4) positive expectancies.

