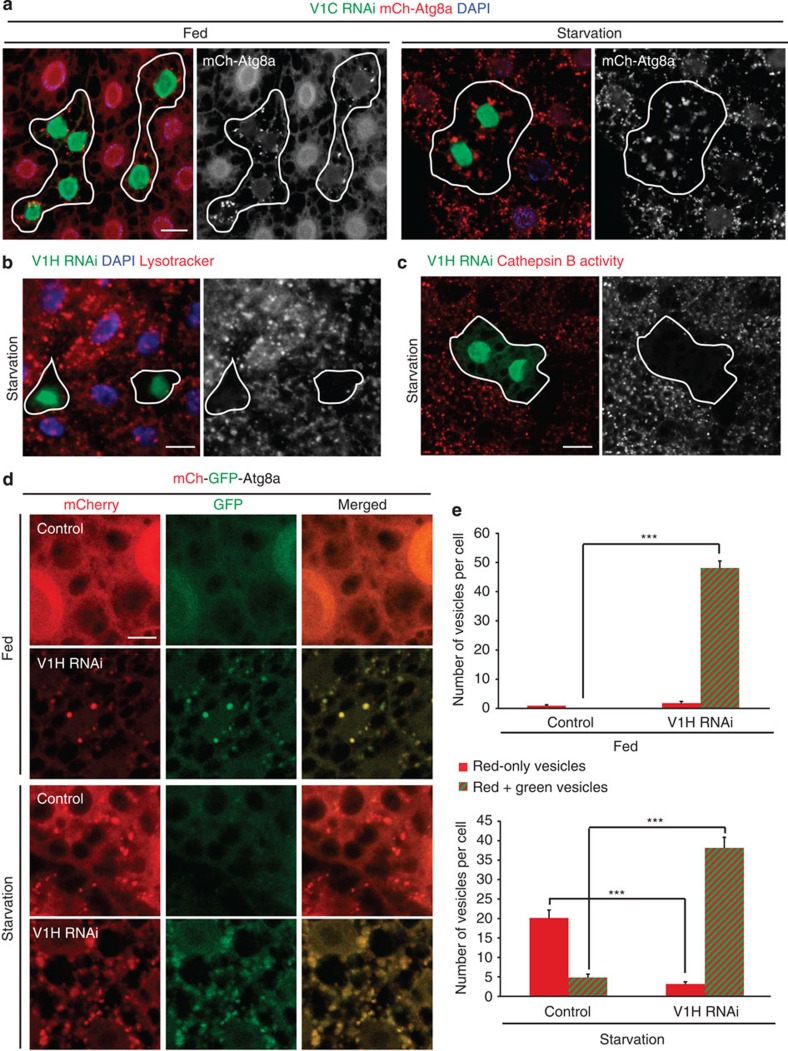
Figure 1. Depletion of V-ATPase subunits leads to accumulation of enlarged, defective autophagic structures.
(a) Representative confocal images of larval fat body expressing mCh-Atg8a (red), which localizes to autophagosomes and autolysosomes in control cells (GFP negative) under 4 h starvation conditions. Cells expressing the transgenic double-stranded RNA that depletes the V-ATPase subunit V1C (GFP-positive clones) accumulate autophagic structures in their cytosol under fed conditions (left) and display enlarged vesicles in starved animals (right). Greyscale images at right show mCh-Atg8a. (b) Loss of V-ATPase subunits inhibits vesicle acidification. Fat body cells were stained with LysoTracker Red, which localizes to starvation-induced acidified autolysosomes in control cells (GFP negative). Cells depleted for V1H (GFP-positive clones) fail to accumulate acidic organelles. The LysoTracker signal alone is shown in the greyscale image at right. (c) Lysosomal enzymes are inhibited in cells depleted for V-ATPase subunits. All cells are stained with Magic Red cresyl violet-(RR)2, which monitors lysosomal Cathepsin B enzyme activity (red). In wild-type cells (GFP negative), Cathepsin B is activated under starvation conditions. Depletion of V1H (GFP-positive clone) results in failure to activate Cathepsin B. Magic Red signal alone is shown in greyscale at right. Scale bar, 10 μm. Nuclei are labelled with 4,6-diamidino-2-phenylindole (DAPI; blue) in a and b. N≥6 larvae tested for each genotype or experimental condition. (d) Representative confocal images of tandem mCherry-GFP-Atg8a expression in fat body cells. In control animals, starvation leads to the formation of acidic autolysosomes, which can be visualized only in the red channel due to quenching of GFP. In cells depleted for V1H, non-acidified (red and green fluorescent) autophagic structures are evident under both nutrient-rich and starvation conditions. Genotypes: control: Cg-GAL4 UAS-mCherry-GFP-Atg8a/+. V1H RNAi: Cg-GAL4 UAS-mCherry-GFP-Atg8a/ UAS-RNAi-V1H. Scale bar, 5 μm. (e) Quantification of number of acidified (red only) and non-acidified (red and green) vesicles from images shown in d. Error bars mark s.e.m., N≥7 larvae per experimental condition. ***P<0.001, Student's t-test.

