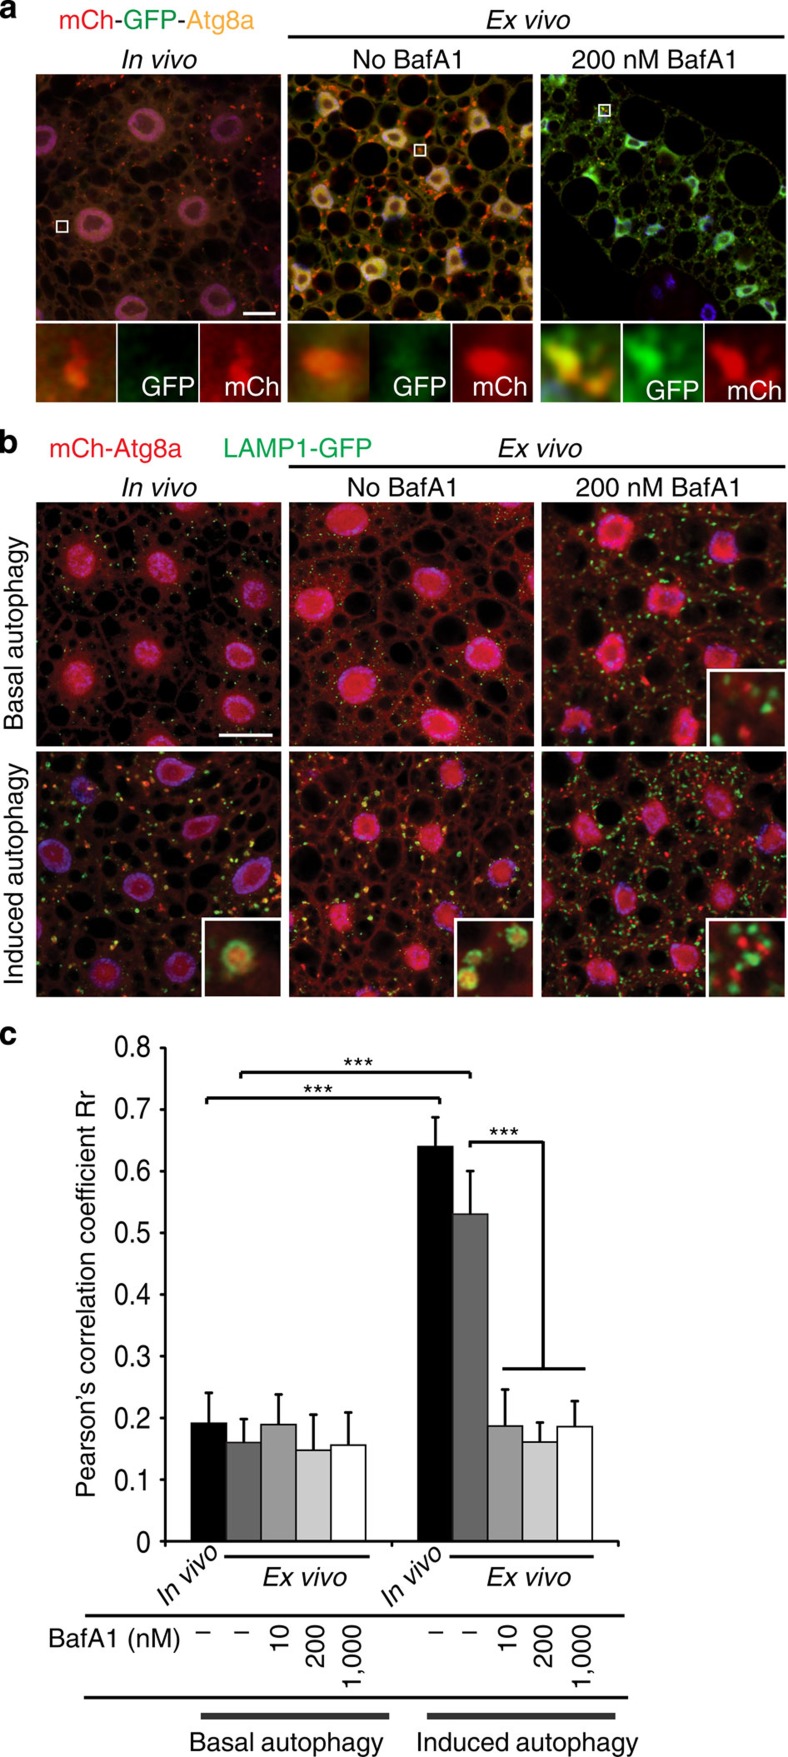
Figure 5. BafA1 inhibits autolysosomal acidification and fusion.
(a) Representative confocal images of fat body cells expressing the tandem-tagged mCherry-GFP-Atg8a reporter. Following 4 h starvation in vivo or 6 h incubation in the absence of BafA1 ex vivo, most mCherry-positive punctae exhibit quenching of the GFP signal, indicating its delivery to the acidic lumen of the lysosome. Cells treated with 200 nM BafA1 accumulate non-acidified autophagic structures positive for both GFP and mCherry. Nuclei are labelled with DAPI; blue. N≥15 for each genotype. Scale bar, 10 μm. Genotype: Cg-GAL4 UAS-mCherry-GFP-Atg8a/+. (b) Representative images of fat body cells co-expressing LAMP1-GFP and mCh-Atg8a incubated ex vivo for 6 h with 200 nM BafA1 in the presence (basal autophagy) or absence (induced autophagy) of 10 μg ml−1 insulin. Nuclei are labelled with DAPI (blue). N≥15 for each condition. Scale bar, 10 μm. Genotype: Cg-GAL4 UAS-mCherry-Atg8a UAS-LAMP1-GFP/+. (c) Quantification of co-localization between LAMP1-GFP and mCh-Atg8a as measured by Pearson's correlation coefficient Rr, using a minimum of 15 images for each condition. Error bars mark s.d. ***P<0.001, Student's t-test.

