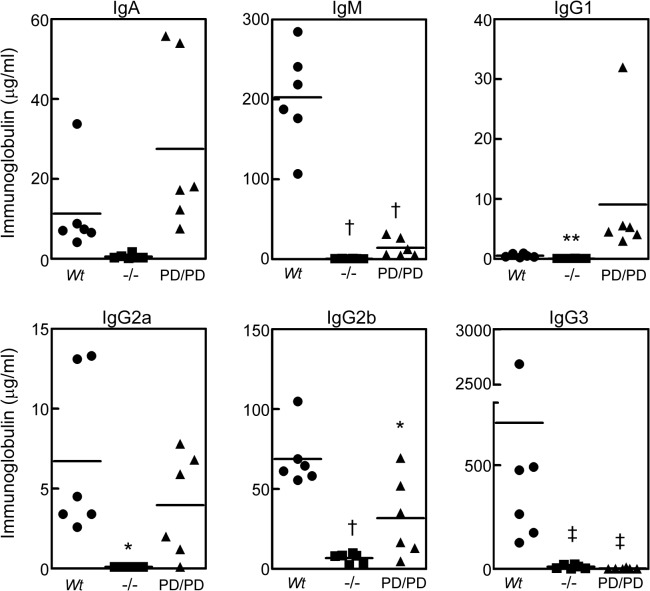
Fig 5. Decreased basal serum Ig levels in MALT1 null and protease-dead mice.
ELISA analysis of IgA, IgG1, IgG2a, IgG2b, IgG3, and IgM levels in non-immunized sera from Wt, Malt1 -/-, and Malt1 PD/PD mice (n = 6/group). Data represents Ig levels in individual animals, and averages are indicated by horizontal lines. Significance was determined relative to the Wt groups, *p < 0.05, **p < 0.01, †p < 0.001, ‡p < 0.0001.

