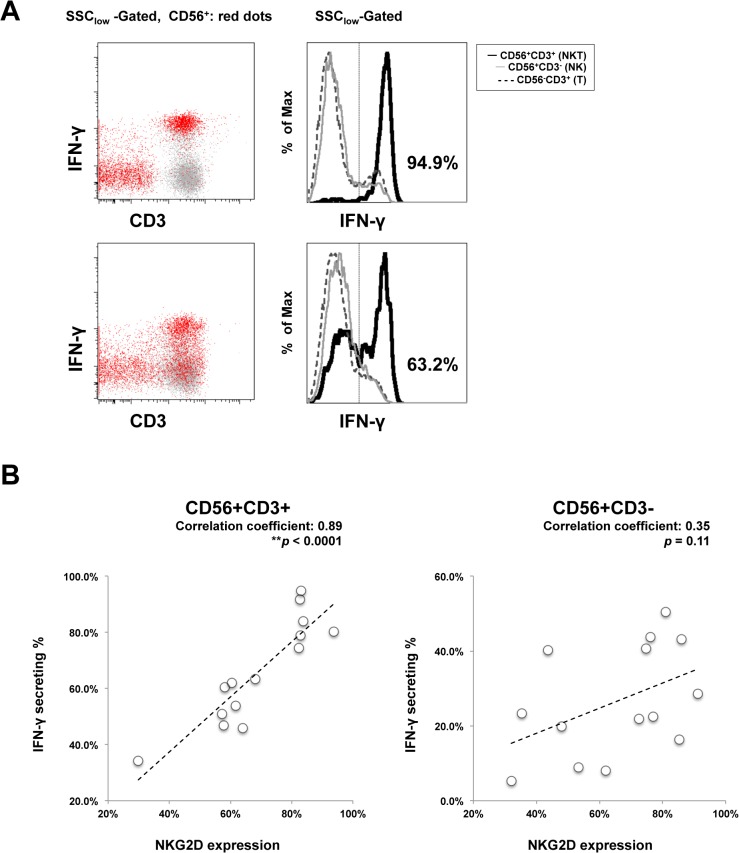
Fig 6. Impaired NKG2D expression on CD56+CD3+ lymphocytes correlates to decreased IFN-γ production.
PBMC were collected and analyzed for surface NKG2D expression by flow cytometry in fourteen chronically HCV genotype 1 infected cases. With the same blood sample and at the same time, 4 hours of PMA/ionomycin stimulations were introduced, and then intracellular IFN-γ production levels were determined in CD56+CD3+ (NKT), CD56+CD3- (NK) and CD56-CD3+ (T lymphocyte) populations. (A) Two representative FACS plots and histograms are from the case of SVR (upper) and non-SVR (lower). CD56+ cells are shown as red dots, and other cells as gray dots. n = 14. Statistical correlation of corresponding NKG2D expression and IFN-i production was analyzed in (B).

