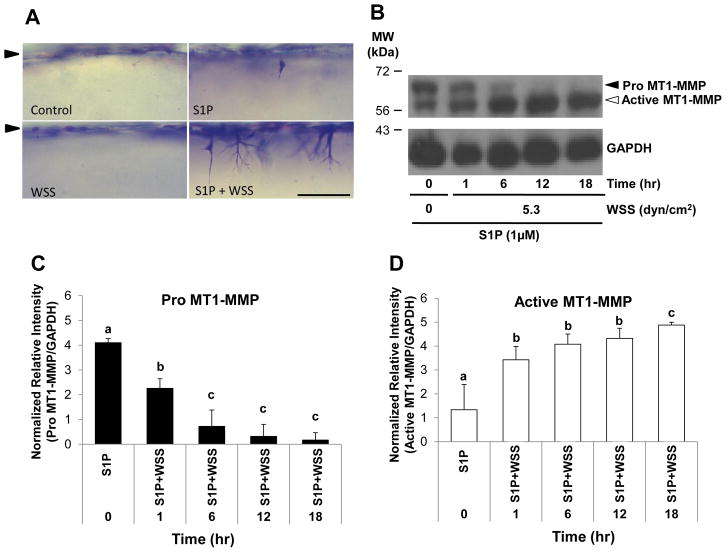
Figure 1. MT1-MMP activation occurred during S1P- and WSS-stimulated EC invasion in 3D collagen matrices.
(A) Representative photographs of invasion responses. Scale bar,100μm. (B) Western blots are shown from ECs treated with or without 5.3 dyn/cm2 WSS and allowed to invade for 0, 1, 6, 12, and 18hr in the presence of 1μM S1P. Cell extracts were probed with antibodies directed to MT1-MMP (top blot) or GAPDH (bottom blot). Black and white arrowheads indicate pro and active MT1-MMP, respectively in all figures. Densitometric analyses of band intensities for (C) Pro MT1-MMP and (D) Active MT1-MMP levels normalized to GAPDH using ImageJ software from 3 independent experiments (means ±S.D.). In all figures, lowercase letters denote groupings from one-way ANOVA followed by post hoc pairwise comparison testing using Tukey’s method (p<0.05).

