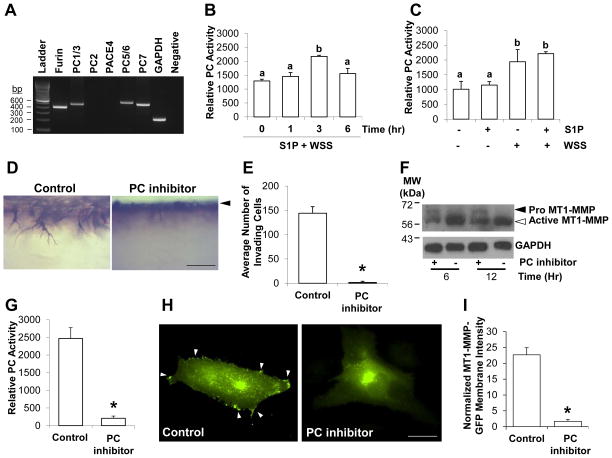
Figure 3. WSS increased proprotein convertase activity, which was required for EC invasion.
(A) Representative RT-PCR using primers validated to amplify proprotein convertases [28]. ECs derived from 3 independent donors were tested with identical results. A representative example is shown. (B) ECs were treated with 5.3 dyn/cm2 WSS for 0, 1, 3, and 6hrs in the presence of 1μM S1P and lysed to measure proprotein convertase activity. (C) ECs were treated with or without 5.3 dyn/cm2 for 3hr in the presence or absence of 1μM S1P and lysed to measure proprotein convertase activity. (D) Photographs showing a side view of invading ECs stimulated with S1P and 5.3 dyn/cm2 WSS in the presence of vehicle control or 25μM PC inhibitor for 24hr. Scale bar, 100μm. Arrowhead indicates original monolayer. (E) Quantification of invasion density from 4 individual experiments (n=20 total wells). Data shown are average number of invading cells +/−S.D. (F) Cell extracts were collected at 6 and 12hr and probed with antibodies directed to MT1-MMP (top blot) or GAPDH (bottom blot). (G) Quantification of PC activity from cell lysates collected at 3hr. (H) ECs were transiently transfected with a vector expressing MT1-MMP-GFP and treated with 5.3 dyn/cm2 WSS and 1μM S1P for 2hr. Photographs of ECs expressing MT1-MMP-GFP are shown treated with or without 25μM PC inhibitor. White arrowheads indicate MT1-MMP-GFP at the cell periphery. Scale bar, 10μm. (I) Quantification of MT1-MMP-GFP localization to the cell periphery as described in “Materials and Methods” from 3 independent experiments. * indicates significant difference from control (Student’s t-test; n=39 cells, p<0.01).

