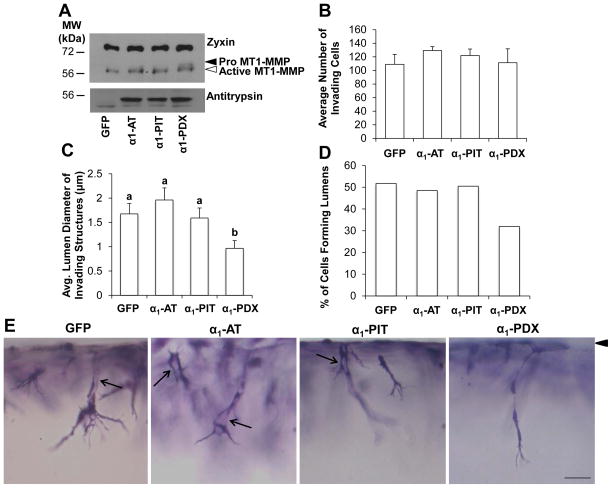
Figure 4. Exogenous expression of proprotein convertase inhibitor decreased lumen formation.
ECs were transduced to express GFP, α1-AT, α1-PIT, or α1-PDX and allowed to invade 2 or 24hr in the presence of 5.3 dyn/cm2 WSS and 1μM S1P. (A) Cell extracts (2hr) were immunoblotted with antibodies against Zyxin to normalize for total protein (top blot), MT1-MMP (middle blot), and Antitrypsin (bottom blot) to demonstrate overexpression of antitrypsin-derived constructs. (B) Quantification of invasion density (24hr invasion). (C) Quantification of the average lumen diameter of invading cells (24hr invasion; n>100 cells, means ±SEM). (D) Percentage of invading structures which contained a lumen (n>100 cells). (E) Photographs illustrating a side view of EC invasion after 24hr. Arrowhead indicates monolayer; arrows indicate lumens. Scale bar, 50μm.

