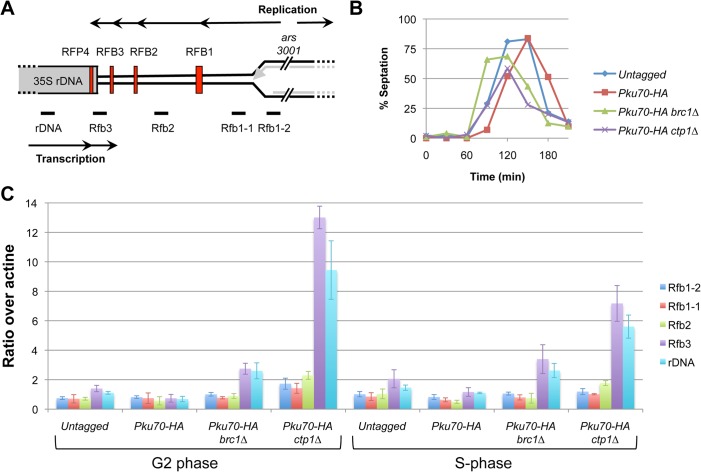
Fig 6. Enrichment of Pku70 at the rDNA RFP4 replication fork barrier in brc1∆ and ctp1∆ mutants.
(A) Diagram of a single rDNA repeat (not to scale) shows the location of the four replication fork barriers (red vertical bars) relative to the 35S rDNA genes, the direction of replication (upper black arrow) from the ars3001 replication origin, the direction of 35S rDNA transcription (lower black arrow) and qPCR primer locations, below graph. (B) Cells were synchronized in G2-phase using the cdc25-22 allele and S-phase progression was monitored using septation index. (C) Pku70 ChIP at the rDNA was performed in untagged, wild type, brc1∆, and ctp1∆ strains synchronized by cdc25-22 block and analyzed by qPCR with the indicated primers. The G2-phase and S-phase samples correspond to 0 and 60 minutes respectively in this experiment.

