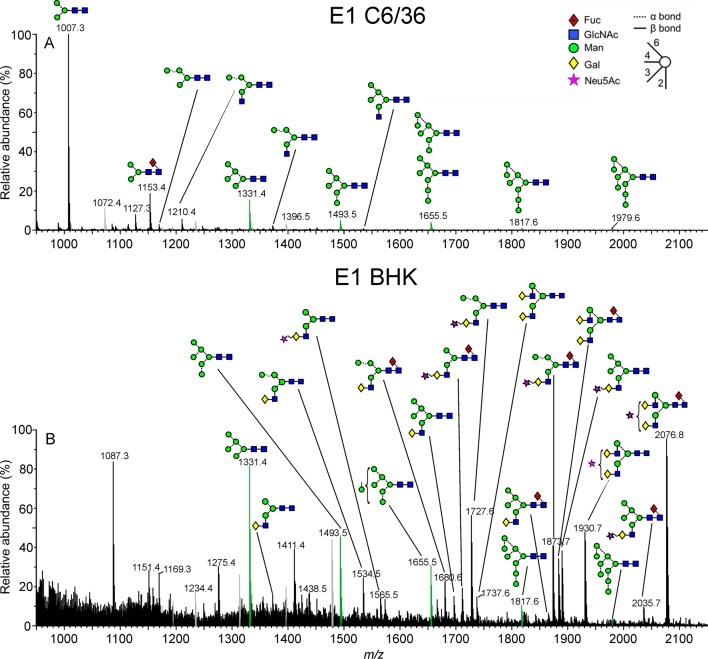
Figure 2.
Mobility-extracted singly negatively charged N-glycan ions from the E1 glycoproteins from the mosquito (spectrum A) and rodent cell lines (spectrum B). A key to the symbols used for the glycan structures is displayed in the upper right-hand corner of panel A. The linkages are shown by the angle of the lines connecting the symbols (| = 2-link, / = 3-link, – = 4-link, and \ = 6-link). α-Bonds are shown with broken lines and β-bonds are shown with full lines. Full details are given in ref (80). Oligomannose-type glycans are highlighted in green, and fragment ions are shown in gray.

