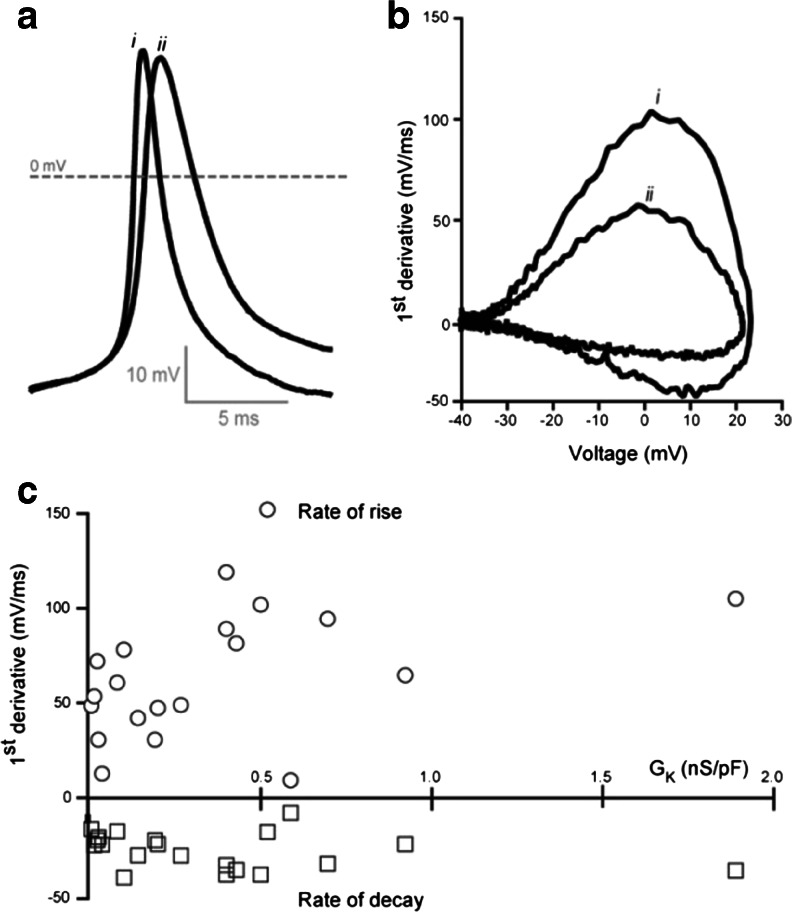
Fig. 5.
Relationship between the magnitude of the K2P-mediated conductance and the AP rise and decay. a Two threshold APs from separate cells are superimposed to illustrate the difference in AP rise and decay. The first AP (i) comes from a cell with a G K of 0.1 nS/pF whereas the second AP (ii) comes from a cell with a G K of 0.5 nS/pF. b Phase plane plots of the two APs shown in a. The maximum AP rise and decay was calculated from these plots. c Plot of the maximum AP rise (open circles) and decay (open squares) for all threshold APs elicited during conductance simulation procedure in relation to the G K for each cell examined

