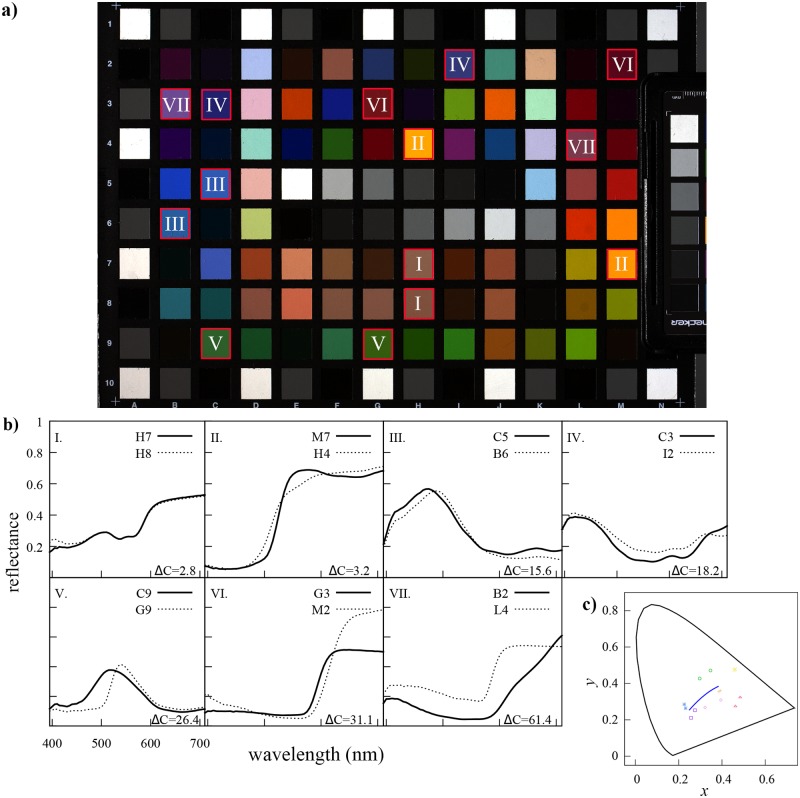
Fig 1. Colorimetric characterisation of the selected target colour pairs.
a. Linear RGB representation of the X-rite ColorChecker SG highlighting the seven colour pairs selected for the experiment. The samples comprising each colour pair are identified by the same roman numeral. b. Reflectance spectra for the 14 individual colour samples making up each one of the colour pairs and their chromaticity difference values (ΔC). Chromaticity difference values were calculated from chromaticity coordinates (Table 2) using formulae and diagrams by MacAdam [48] and assuming a mercury discharge lamp illumination. Individual colour samples are identified by their unique coordinates in the chart (panel a). c. Colour samples in the 1931 CIE chromaticity diagram: (+) pair I, (×) pair II, (*) pair III, (◻) pair IV, (○) pair V, (△) pair VI and (⋄) pair VII. Colour key of each pair is a crude representation of the linear RGB combination for each pair in panel a.

