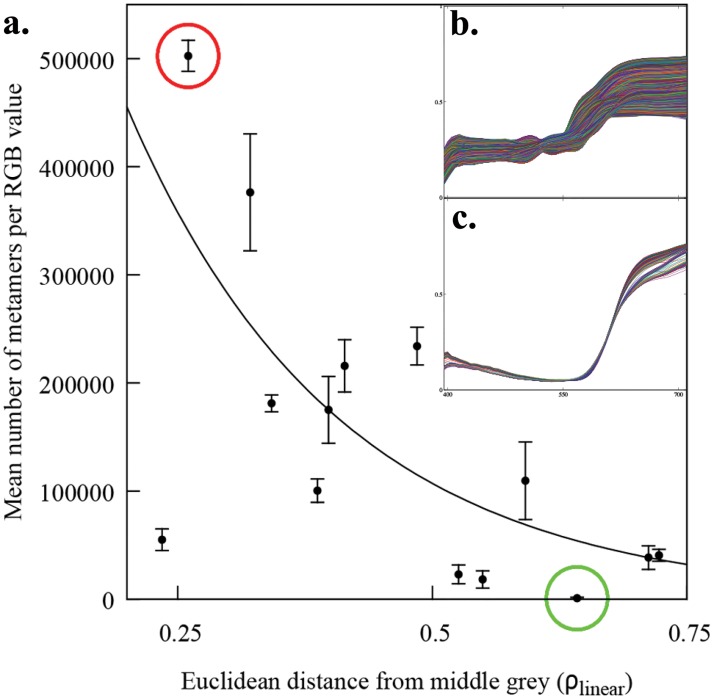
Fig 4. Mean number of metamers recovered from a given ρ R, ρ G, ρ B triplet camera response as a function of distance from the mid point of the RGB linear space.
In panel a. each point corresponds to the mean number of metamers recovered for each ρ triplet and the error bars represent standard deviation from the mean. Solid line represents the best fit of an exponential model of the form y = y 0 exp−(bx) (Eq 5) fitted by means of a least absolute deviation (LAD) regression [107]. b. Metamer set (477,341 metamers) for ρ R = 0.508, ρ G = 0.327, ρ B = 0.246 located at 0.307 linear RGB units from the center (red circle in a.) corresponding to a pixel sample from colour target H8 in Fig 1. c. Metamer set (483 metamers) for ρ R = 0.337,ρ G = 0.025,ρ B = 0.097 located at 0.644 linear RGB units from the center (green circle in a.) corresponding to a pixel sample from colour target M2 in Fig 1.

