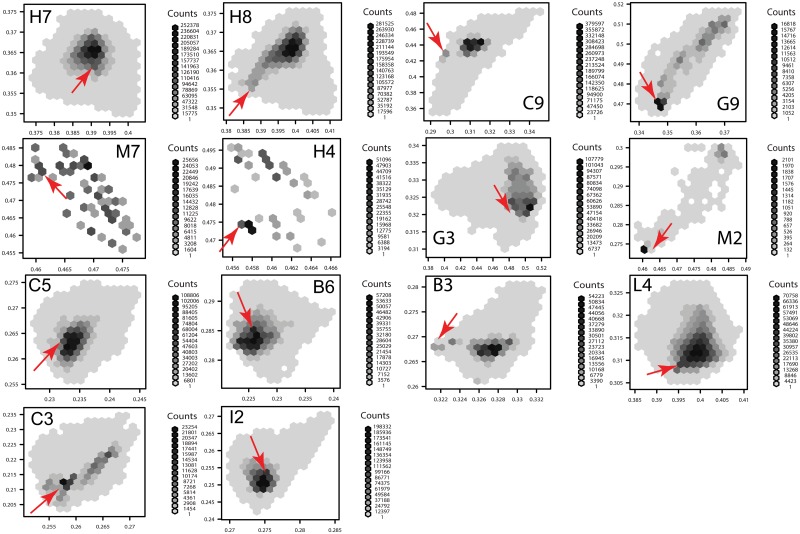
Fig 6. Density scatter plot expressed as hexagonal bins [108] summarising the frequency of chromaticity values obtained from the metamer sets reconstructed from 10 camera response triplets corresponding to each of the 14 colour samples in Fig 1.
The number of metamers resulting in the same chromaticity values is represented by grey shades as indicated under the label ‘counts’ for each colour sample. The red arrow on each panel indicates the chromaticity coordinates obtained from the measured reflectance spectrum (panels b and c in Fig 1), and presented in Table 2.

