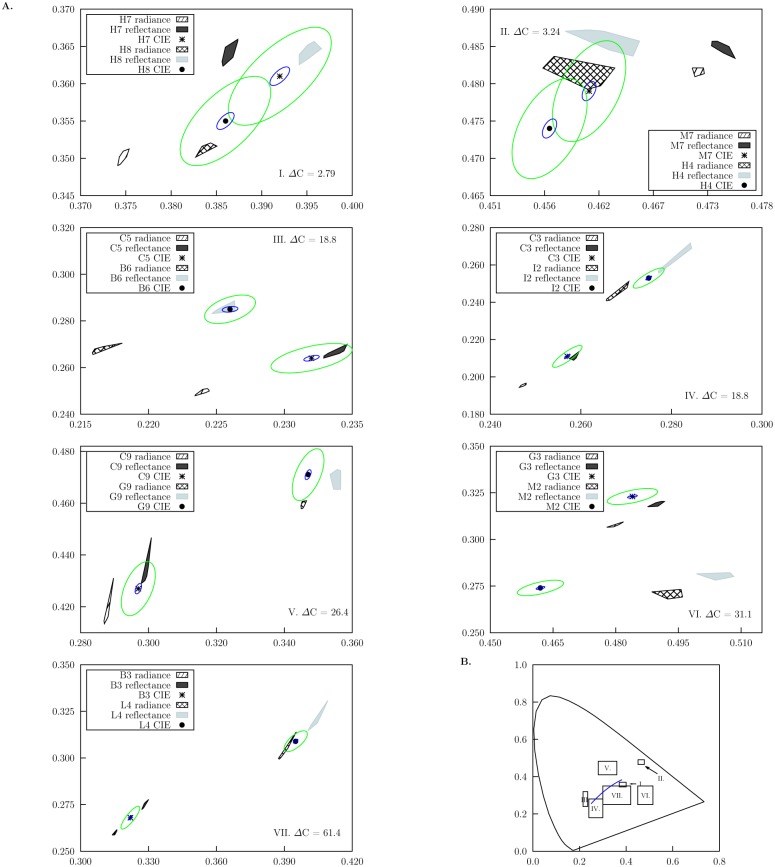
Fig 8. Chromaticity areas (CAs) corresponding to the convex hull of chromaticity coordinates calculated from the radiance and smoothed reflectance spectra reconstructed from 10 pixel responses in the hyperspectral image cube containing the hyperspectral camera responses for the different colour samples in Fig 1, and assuming a mercury discharge lamp as light source (Fig 2).
A. Panels correspond to each one of the seven different colour pairs used in our experiment; colour difference values (ΔC) between the pair members are included on each panel. Patterned areas correspond to CA’s calculated from reconstructed radiance spectra, whilst solid shaded areas to CAs calculated from smoothed reflectance spectra for the two colours of each sample pair. Note that confusion regions were not obtained from CAs reconstructed from the hyperspectral camera responses. Chromaticity coordinates calculated from measured reflectance spectra are indicated by the (*) and (●) markers. Ellipses represent MacAdam’s [48] (blue) and Newhall [50] (green) colour-difference thresholds calculated for the chromaticity coordinates obtained from measured spectral data. Both ellipses are drawn at their actual scale. B. Regions in the 1931 CIE Chromaticity Diagram covered by the x and y axis of the panels in A. Variations in area size are due to differences in scale required for plotting the two colours making up each sample pair.

