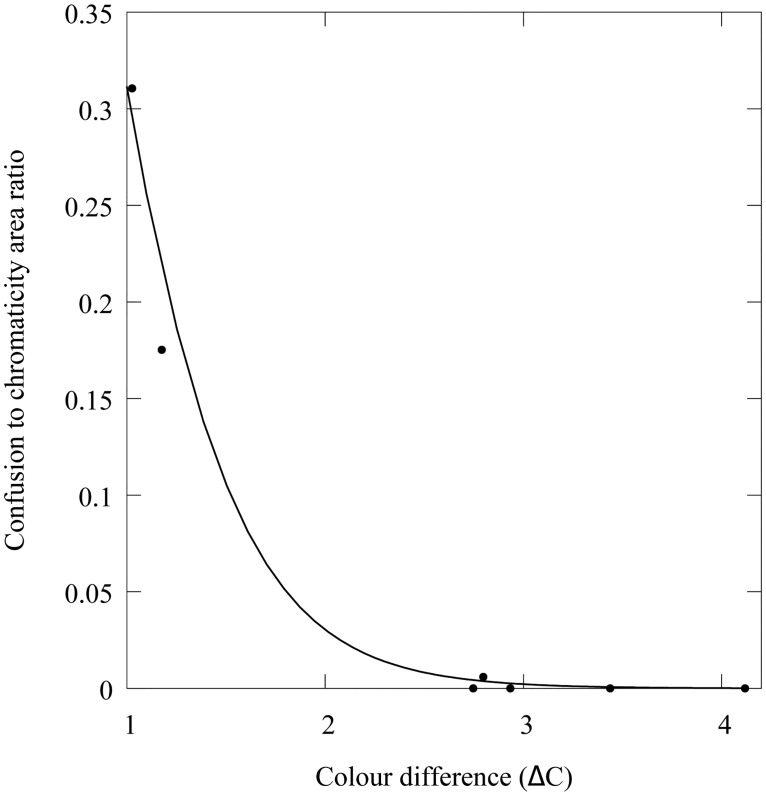
Fig 9. Effect of colour difference (ΔC) in the size of the confusion region for the chromaticity areas corresponding to the metamer sets recovered from the seven colour pairs in Fig 1.
The confusion region for each sample pair is defined as the ratio of intersected area to the sum of the individual chromaticity areas of the two colour samples constituting a pair. Chromaticity areas correspond to those displayed in Fig 6. Solid line represents the best fit of an exponential model of the form y = y 0 exp−(bx) (Eq 6) resulting from a logistic regression using a logit link function.

