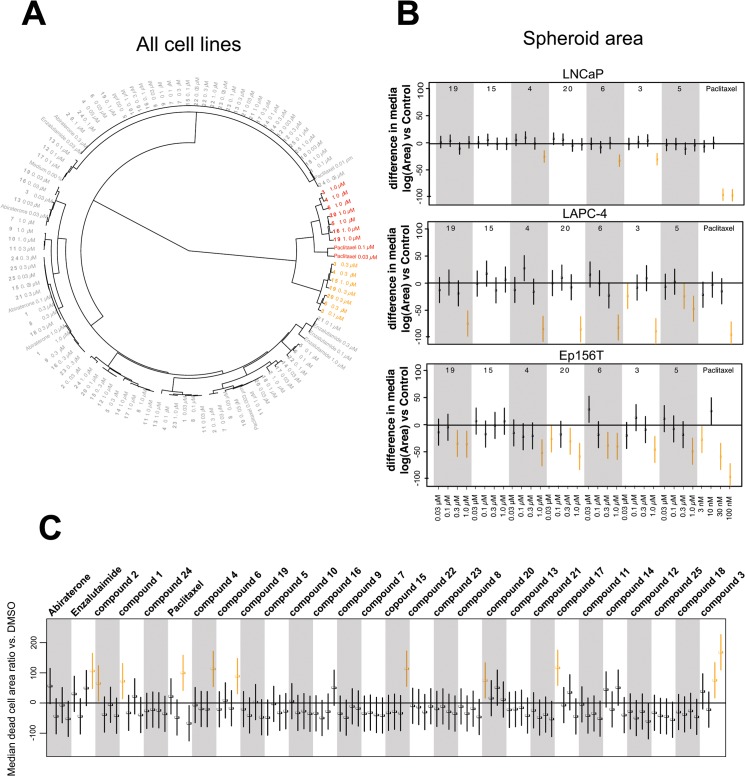
Fig 5. Secondary 3D screens.
Experimental betulin derivatives and control compounds were tested across a panel of prostate cancer lines (LNCaP, LAPC-4) and non-transformed, prostate epithelial cells (EP156T) in 3D culture. A) The dendrogram is based on three main morphological parameters and combines all data from primary and secondary 3D screens. Effective compound treatments are indicated in red and yellow, yellow being the most invasion-specific. B) Boxplots showing the impact of selected compounds on spheroid size (Area). Data scaling: as described in Fig 4 C) Effects of all betulin derivatives and control compounds on cell death (number of dead cells).

