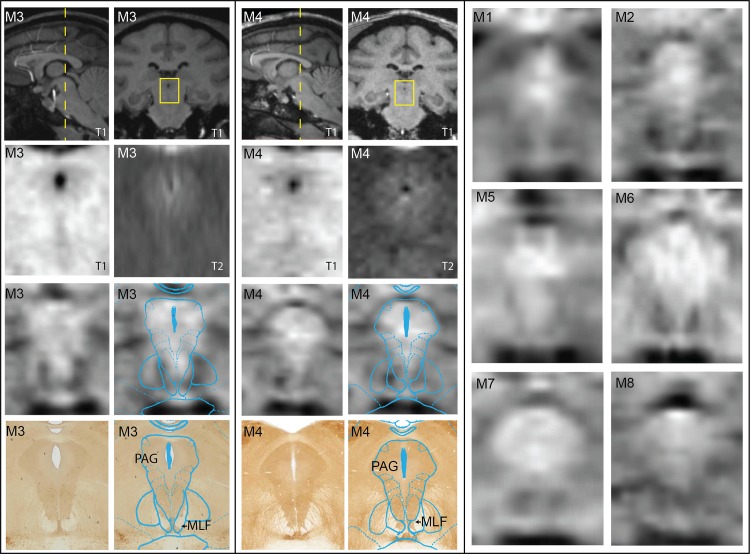
Fig 6. Imaging PAG with comparisons between MRI modalities and immunolabeled histology.
Coronal SWI, T1, and T2 images were matched to corresponding histological slices stained with AChE from the same animal (M3 and M4). The corresponding warped atlas was overlaid on both the SWI and the histology. On the right, matched coronal SWI slices are shown for all other animals. Histograms for all coronal MRI slices were not altered, but stretched to encompass the entire spectrum (0–255).

