
Fig 3. Comparison of the borders of LSC, SSC, and IR regions between the chloroplast genomes of two Fagopyrum species.
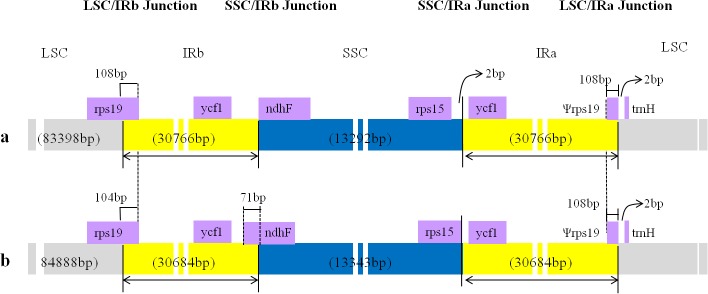
a. F. tataricum . b. F. esculentum.
Official websites use .gov
A
.gov website belongs to an official
government organization in the United States.
Secure .gov websites use HTTPS
A lock (
) or https:// means you've safely
connected to the .gov website. Share sensitive
information only on official, secure websites.
a. F. tataricum . b. F. esculentum.