
Fig 4. Gene-specific Ks values between the chloroplast genomes of two Fagopyrum species (F. tataricum and F. esculentum).
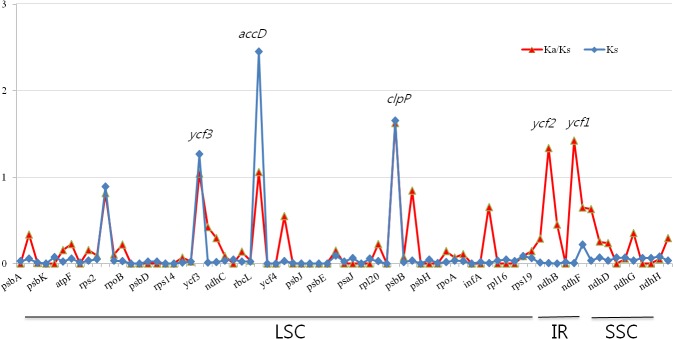
The Ks value was calculated with PAL2NAL. Four genes (rpoC2, ycf3, accD, and clpP) returned Ks values greater than 0.5, whereas the Ks values of the other genes were below 0.5.