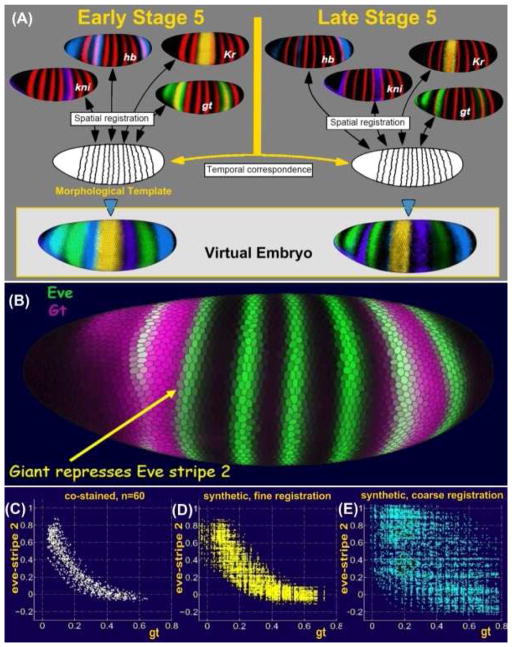
Figure 2. Construction of a VirtualEmbryo.
Images from hundreds of embryos were grouped into temporal cohorts and each cohort registered based on a common pair-rule marker gene, shown in red. Expression patterns of many other genes stained in different embryos were thus brought into a common frame. Temporal correspondence between registered cohorts produces the VirtualEmbryo atlas of multiple genes over multiple times (A). The accuracy of the VirtualEmbryo was demonstrated by plotting the co-expression of gt and eve for a set of cells along the anterior boarder of eve stripe 2, which are known to be repressed by gt (B).
A plot of the co-expression of gt and eve in embryos co-stained for eve and gt shows a clear anti-correlation (C). A plot of the co-expression of gt and eve for these cells in embryos co-stained for eve-ftz and gt-ftz and registered using ftz, show the same anti-correlation (D). However, a plot of co-expression of gt and eve in embryos co-stained for eve-ftz and gt-ftz which were only coarsly registered is much less accurate and does not reveal the anti-correlation (E).

