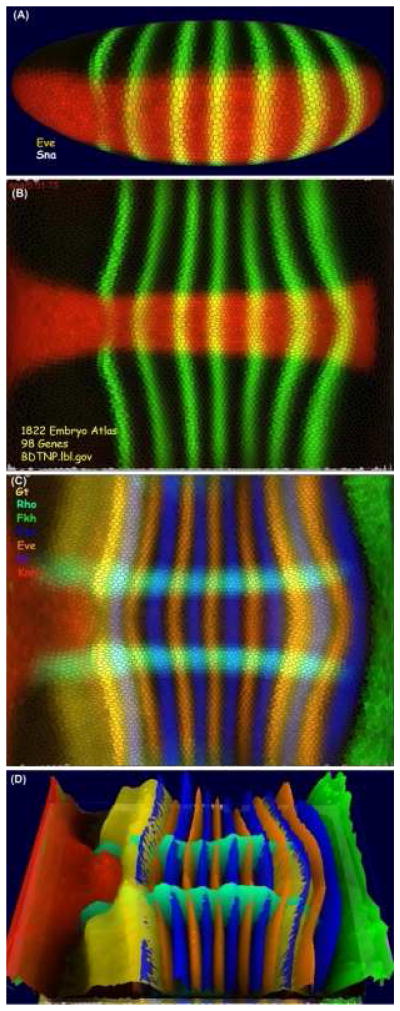
Figure 3. PointCloudXplore.

The visualization tools of the blastoderm project provide multiple physical views. This figure shows expression patterns of eve and sna (A, B) and gt, rho, fkh, ftz, kr and kni (C, D) from the blastoderm atlas. The patterns can be visualized in 3D on a virtual embryo, which can be rotated to any angle, (A) or the embryo surface can be unrolled to reveal the entire pattern in a 2D view (B, C). This view can also be rotated and height maps of the relative expression for each gene added (D).
