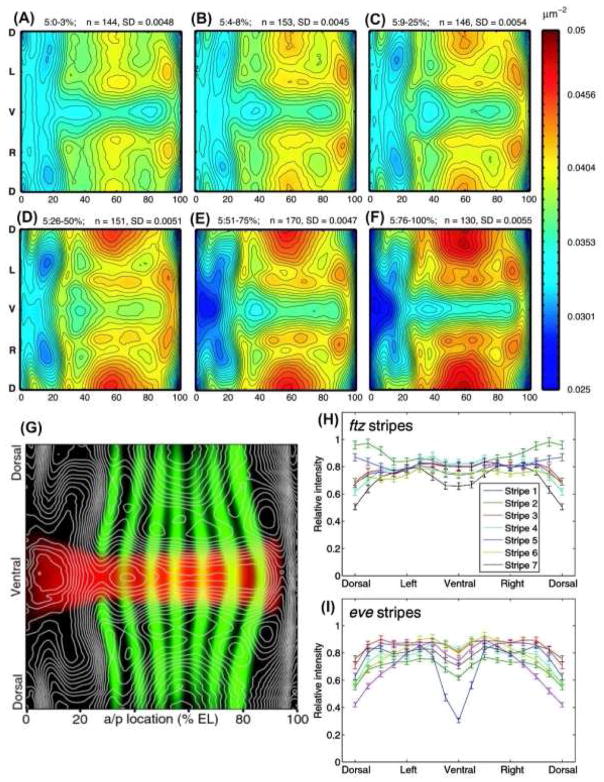
Figure 4. Complex Motions of Nuclear Density and patterns.
Stage 5 blastoderm embryos show a complex dynamic pattern of nuclear packing densities. Spatial nuclear densities were calculated for several temporal cohorts of embryos through stage 5 as the number of nuclear centers per μm2. The resulting density maps were computationally unrolled into a 2D projection (A–F). Nuclear densities are represented as a color heat-map with lowest densities (0.025 nuclei/μm2) in blue and the highest densities in red (0.05nuclei/μm2). Isodensity contours were overlayed with expression patterns of sna and eve (G). Expression of pair-rule stripes of ftz and eve vary significantly around the D/V axis (H and I). The stripes show marked differences in expression profiles and have unique modes of expression variation along the D/V axis. The error bars give the 95% confidence intervals for the means. The data were derived from 155 embryos.

