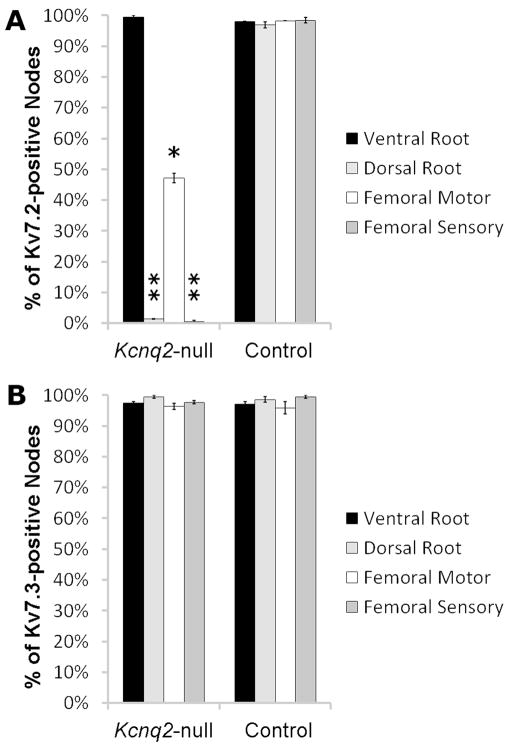
Figure 7. Selective loss of Kcnq2, but not Kcnq3, from the nodes of sensory axons.
The bars represent average proportion of panNav-positive nodes that are Kv7.2- (panel A) or Kv7.3- (panel B) positive from the indicated source (n=3 for all samples). Note that ~0% of nodes in the dorsal root and femoral sensory branch, and 50% in the femoral motor branch, were Kv7.2-positive. Error bars represent SEM; * p<0.05; ** p<0.01 (twoway ANOVA).

