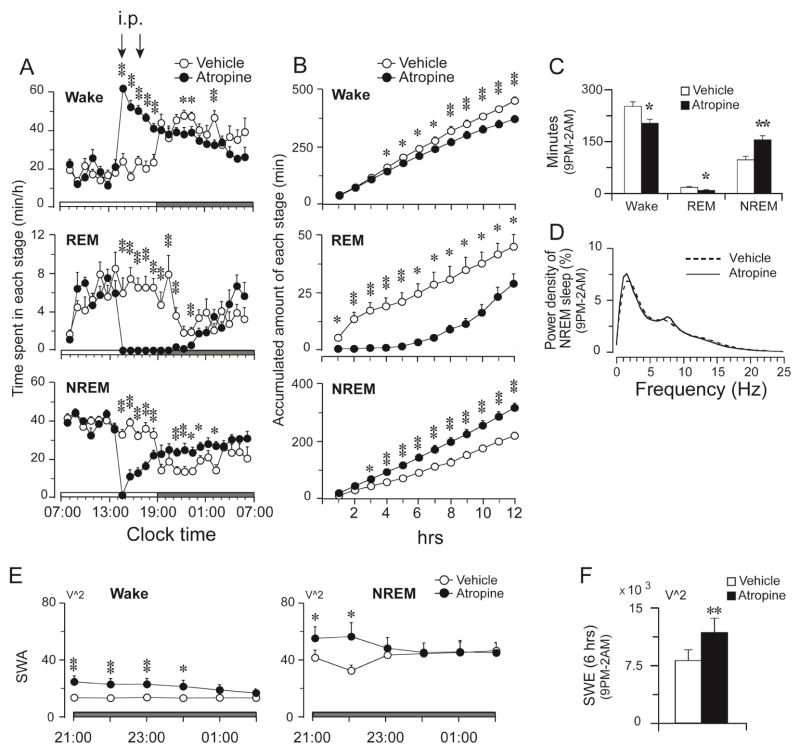
Figure 2.
Sleep rebound after atropine effect abated. A: Time course changes produced by saline and atropine injections (100 mg/kg) at 2:00 PM and 4:00 PM. Open and filled circles represent the hourly mean ± SEM of NREM, REM sleep, and wakefulness by vehicle and atropine injections respectively. B: Hourly accumulated amount of Wake, REM and NREM sleep during the dark phase. C: Total time spent in wakefulness, REM and NREM sleep during 6 hrs (from 9:00 PM to 2:00 AM). D: EEG power density of NREM sleep during the sleep rebound (from 9:00 PM to 2:00 AM) and control shows the same pattern. E: Average SWA (0.5–4 Hz) changes of wake and NREM sleep during the sleep rebound period. Each circle represents mean (per minute) ± SEM of SWA of wake and NREM sleep during each hour. F: Total amount of wake and NREM sleep SWE during the sleep rebound period. Open and filled bars present the control and atropine group respectively (n=8).

