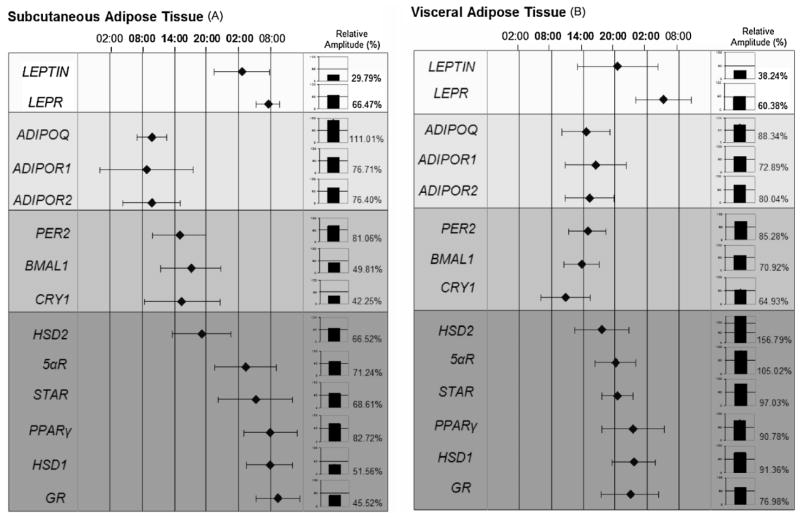
Fig. 1.
A phase map of circadian rhythms of several genes (leptin and its receptor (LEPR), adiponectin and its receptors (ADIPOR1 and ADIPOR2), clock genes (PER2, BMAL1, and CRY1)and glucocorticoid metabolism-related genes(PPARγ, GR, HSD1, HSD2, STAR, and5αR))implicated in human adipose tissue metabolism subcutaneous adipose tissue (A), visceral adipose tissue (B). This figure shows the acrophase (time of occurrence of the best-fit maximum value) of numerous rhythms. The mean values of achrophases are plotted ± SEM.

