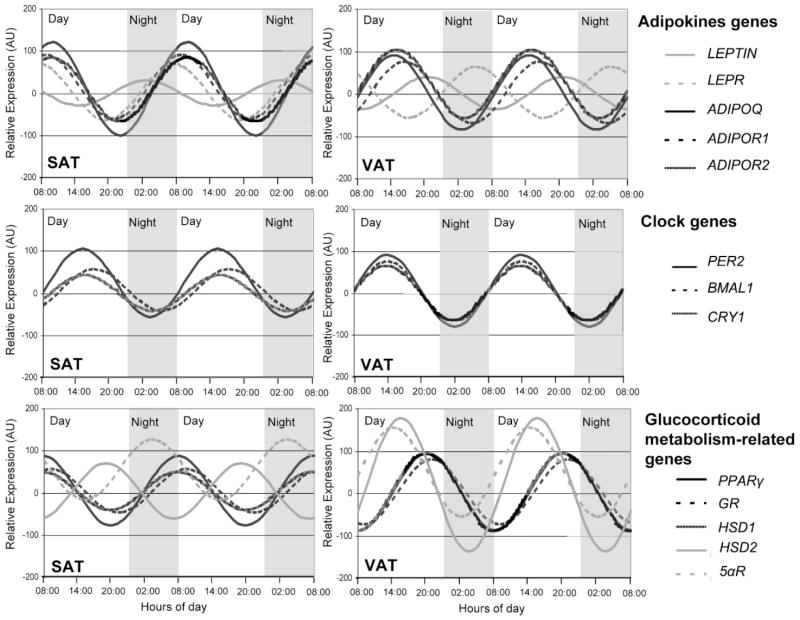
Fig. 2.
Rhythmic expression of genes studied (leptin and its receptor (LEPR), adiponectin and its receptors (ADIPOR1 and ADIPOR2), clock genes (PER2, BMAL1, and CRY1) and glucocorticoid metabolism-related genes (PPARγ, GR, HSD1, HSD2, and 5αR)) in human subcutaneous (A) and visceral adipose tissue (B). Adipose depots were isolated at 6-h intervals over the course of the day from adipose tissue cultures (time at 0, 6, 12, and 18 h). Results are presented relative to the lowest basal relative expression for each gene. Data of relative expression are represented as arbitrary units (AU). Data are reported as means ± SEM (SEM of ΔCt are represented in parenthesis).

