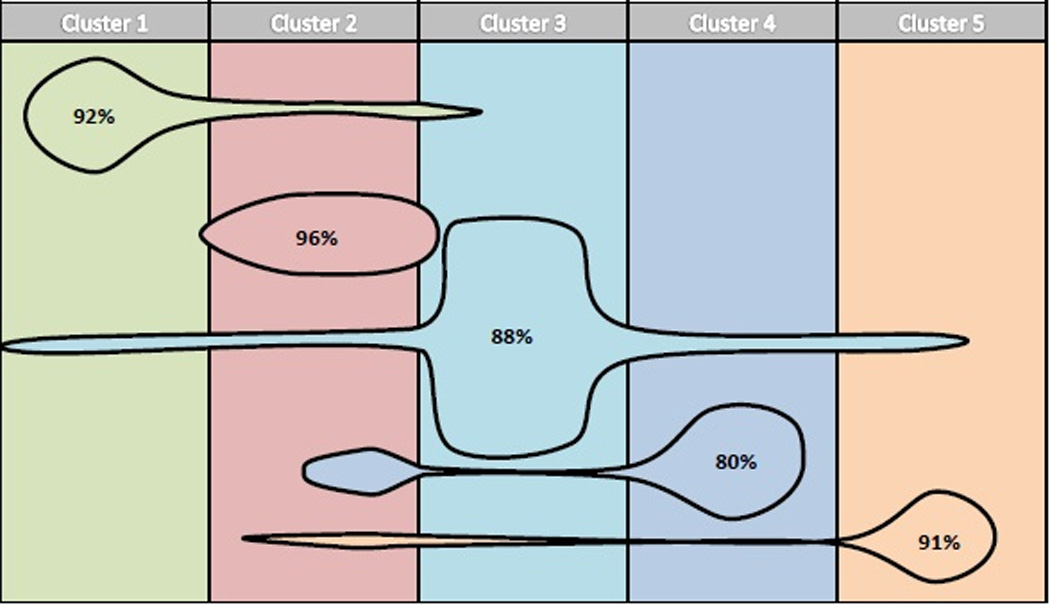
Figure 3.

Based on the clinical algorithm developed using discriminant analysis, 89.4% of all individuals are categorized into the appropriate cluster, with individual clusters ranging from 80–96% correct classification. The size of each figure is proportional to the frequency/size of each specific cluster and overlap into other clusters signifies the percentage of misclassification.
