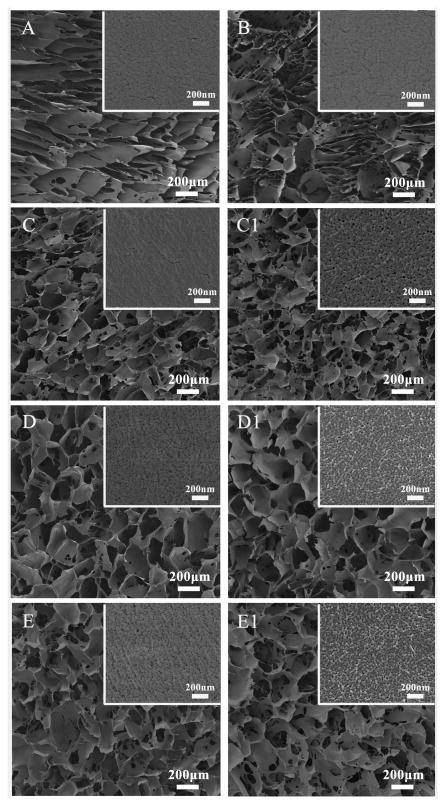
Fig. 3.
SEM morphologies of silk fibroin scaffolds with different contents of silk fibroin nanofibers before (A-E) and after water immersion treatment (C1-E1): (A)SS-0, silk fibroin nanofiber content 0%; (B) SS-2, silk fibroin nanofiber content 2%; (C) SS-6.3, silk fibroin nanofiber content 6.3%; (D) SS-11.8, silk fibroin nanofiber content 11.8%; (E) SS-33.3, silk fibroin nanofiber content 33.3%. The samples (C1-E1) are the corresponding scaffolds of samples (C-E) after water immersion treatment. The insert images show the high magnification morphology of the porous walls of the scaffolds.

