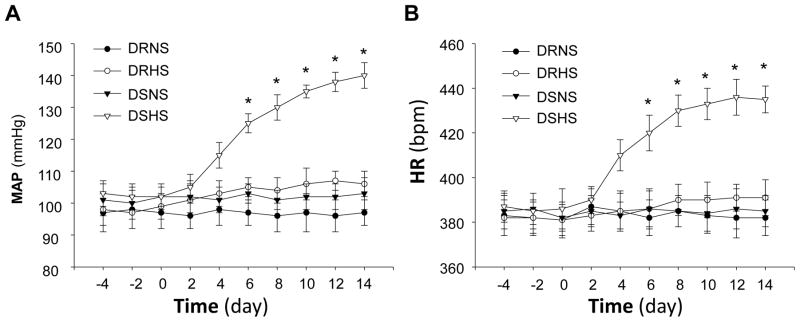
Figure 1.

Effect of high salt diet on MAP and HR in Dahl S rats vs. Dahl R rats. The MAP (A) and HR (B) were recorded using radiotelemetry in Dahl S and Dahl R rats before and after switching the diet (at day 0 as indicated in the figure) from regular salt to high salt. The MAP and HR were significantly elevated in Dahl S rats on high salt diet as compared with Dahl S rats on low salt diet or Dahl R rats. Data are mean±SE from 8 rats in each group. *P<0.05 as compared with Dahl R rats on high salt diet.
